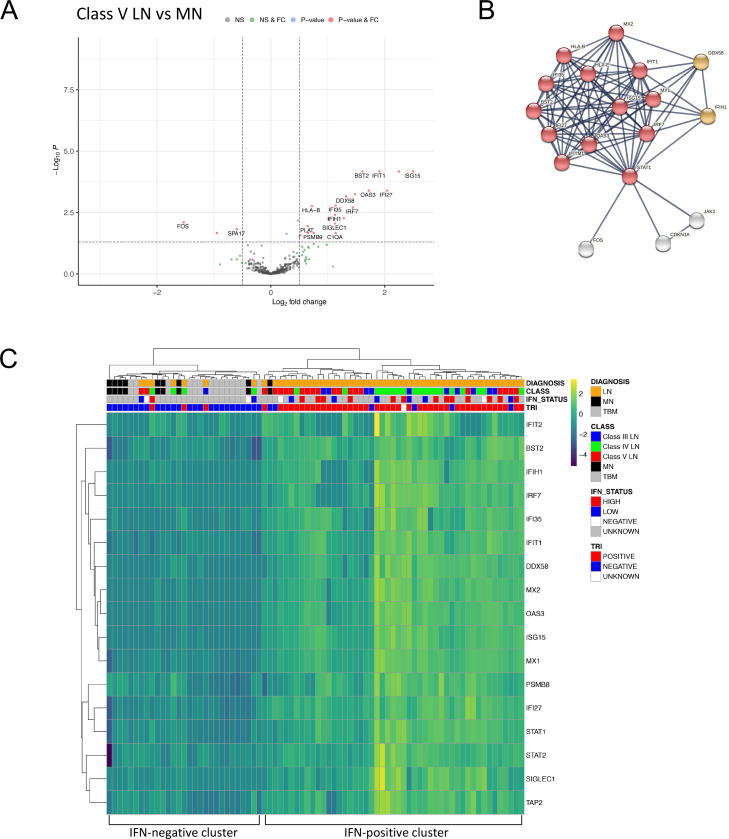
Figure 2.
DGE in class V lupus nephritis compared with idiopathic MN. (A) Volcano plot depicting DGE of class V LN (n=21 biopsies) vs MN (n=9 biopsies). Benjamini-Hochberg adjusted p=0.05 and log2 FC cut-off=0.5. (B) STRING interaction network for all 26 significant differentially expressed genes between class V LN and MN (highest confidence score=0.9). Red nodes—type I IFN; orange nodes—regulation of type III IFN. (C) Heatmap of type I IFN-associated genes across the entire cohort (LN n=55 biopsies, MN n=9 biopsies, TBM n=14 biopsies). IFN status refers to blood IFN score (see methods). DGE, differential gene expression; FC, fold change; MN, membranous nephropathy; TRI, tubuloreticular inclusions.

