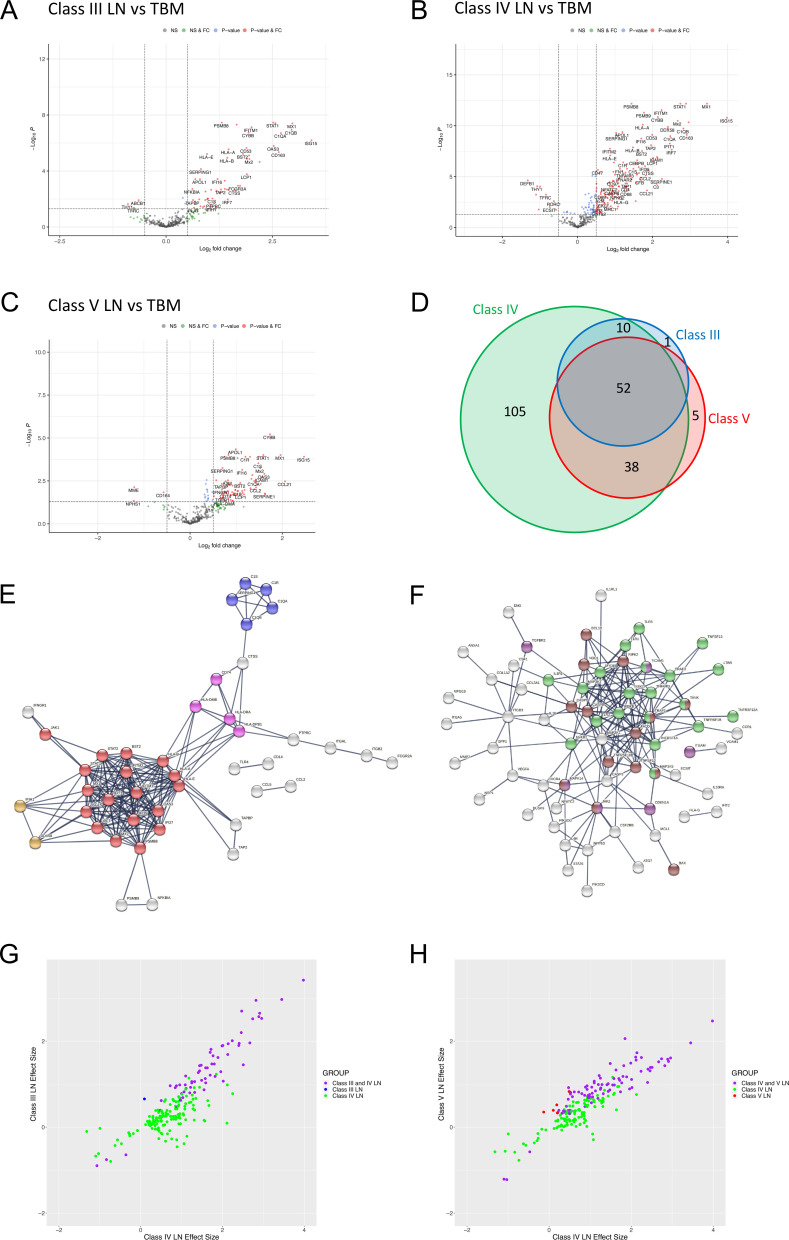
Figure 3.
Immune gene expression analyses in LN subclasses. (A–C) Volcano plots depicting differentially expressed genes in (A) class III LN (n=11 biopsies), (B) class IV LN (n=23 biopsies) and (C) class V LN (n=21 biopsies) vs TBM disease (n=14 biopsies). Benjamini-Hochberg adjusted p=0.05 and log2 FC cut-off=0.5. (D) Area proportional Venn diagram of overlapping differentially expressed genes between class III (63 genes), class IV (205 genes) and class V (95 genes) LN. (E, F) STRING interaction networks using the highest confidence score (0.9) for all 52 significant differentially expressed genes that were common to all LN classes (E) and all 105 genes that were only significant in class IV LN (F). Red nodes—type I IFN; blue nodes—complement cascade; pink nodes—MHC II; orange nodes—regulation of type III IFN; light green nodes—NF-κB+TIR domain; purple nodes—positive regulation of ROS metabolic process; brown nodes—positive regulation of pepsidase activity. (G, H) Plots comparing the effect sizes of all 205 differentially expressed genes in class IV LN with either class III LN (G) or class V LN (H). Data points are coloured according to groups defined in the Venn diagram (D), with intersections shown in purple. FC, fold change; LN, lupus nephritis; TBM, thin basement membrane.

