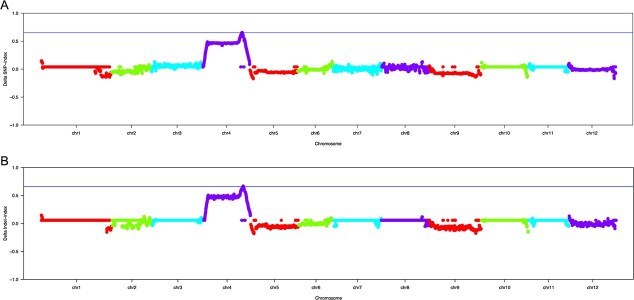
Figure 2.
Preliminary mapping of oft3 by using BSA-seq analysis. a Identification of the oft3 candidate region through the ΔSNP index association analysis method. b Identification of the oft3 candidate region through the ΔInDel index association analysis method. The X-axis represents the positions of twelve tomato chromosomes, and the Y-axis represents the Δ index. The colored dots represent the index value of every SNP/InDel locus. The blue imaginary lines indicate the association threshold of the Δ index.

