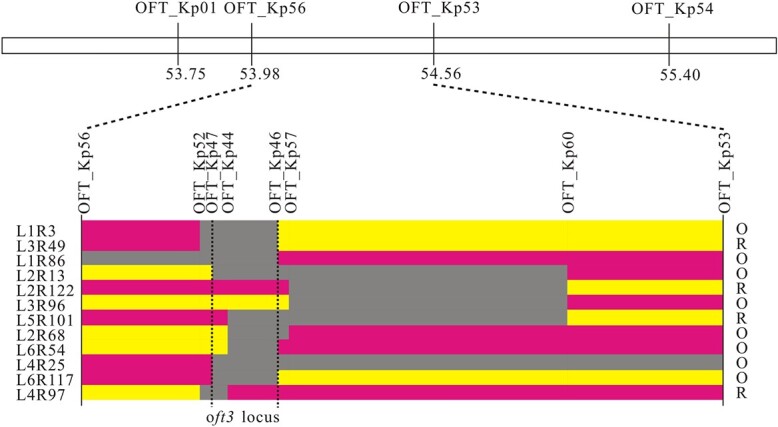
Figure 3.

Fine mapping of oft3. The ten KASP markers shown above were used to screen recombinant individuals from the F2 population and the F3 population. The number of each individual recombinant plant is indicated to the left of the figure, and the fruit color phenotype is indicated to the right. Yellow blocks represent homozygosity, red blocks represent heterozygosity, and gray blocks represent the interval where crossover took place. The oft3 locus was refined to a 71.23 kb interval (54 083 697 ~ 54 154 931 bp) between markers OFT_Kp46 and OFT_Kp47 on chromosome 4. R: red-fruited phenotype; O: orange-fruited phenotype.
