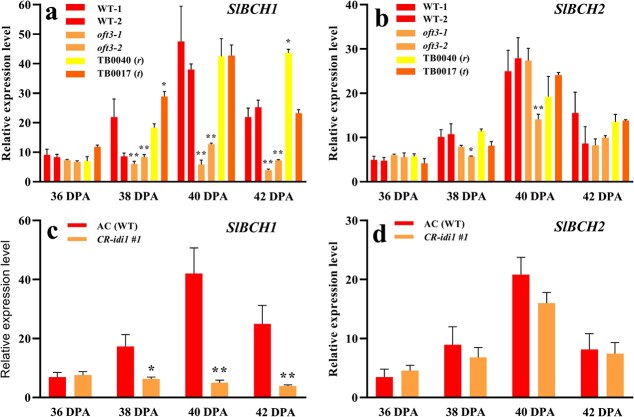
Figure 9.
Expression analysis of SlBCH1 and SlBCH2 by qRT–PCR in the fruit of the SlIDI1 mutant at four ripening stages. a and b Expression analysis of SlBCH1 and SlBCH2 in two wild-type (WT-1 and WT-2) and two oft3 genotyped individuals (oft3–1 and oft3–2) from the segregating BC1F2 population. c and d Expression analysis of SlBCH1 and SlBCH2 in the CRISPR–Cas9-generated SlIDI1 mutant CR-idi1 #1 compared with its parental line AC. Values are the means of four biological replicates ± SD and were compared between genotypes at the same ripening stage. Asterisks denote significance by Student’s t-test (*P < 0.05, **P < 0.01). DPA: days post-anthesis.

