
Figure 3.
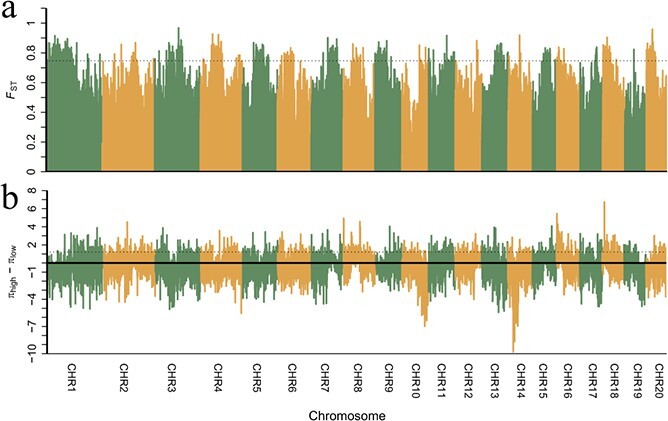
Plots of selection signature distributions on the genome, identified by Fst value (a) and nucleotide diversity (θπ) reduction (πhigh – πlow) (b). The dashed line indicates the threshold value (the top 5%) for the identification of selection signatures.