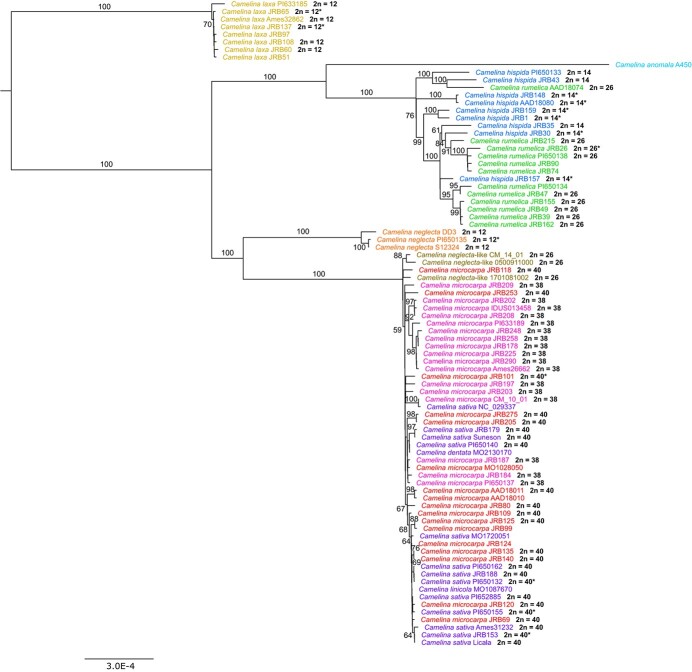
Figure 2.
Maximum-likelihood tree of Camelina inferred using whole chloroplast genomes. Taxon labels are colored according to taxonomy. Numbers on branches correspond to bootstrap supports, values over 50% are shown. Chromosome counts (bolded) are provided to the right of taxa where available. Scale represents evolutionary distance in number of substitutions per site. Asterisks represent previously reported chromosome numbers (see Supplemental Table 1).

