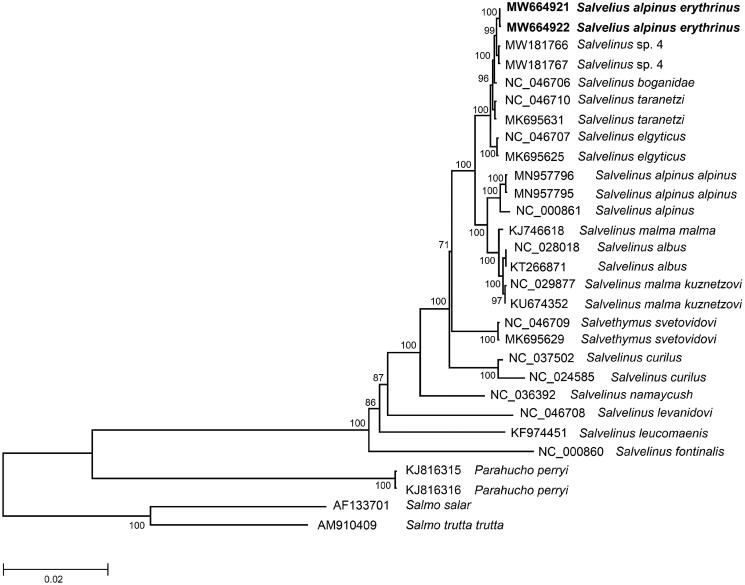
Figure 1.
Maximum-likelihood (ML) tree constructed from comparison of complete mitogenome sequences of Salvelinus alpinus erythrinus and other GenBank representatives of the family Salmonidae. The tree is based on the GTR plus gamma plus invariant sites (GTR + G+I) model of nucleotide substitution. GenBank accession numbers for all sequences are listed in the figure. Numbers at the nodes indicate bootstrap probabilities from 1000 replications. The mitogenome sequences of Salvelinus alpinus erythrinus in this study are marked in bold. Phylogenetic analysis was conducted in MEGA X (Kumar et al. 2018).

