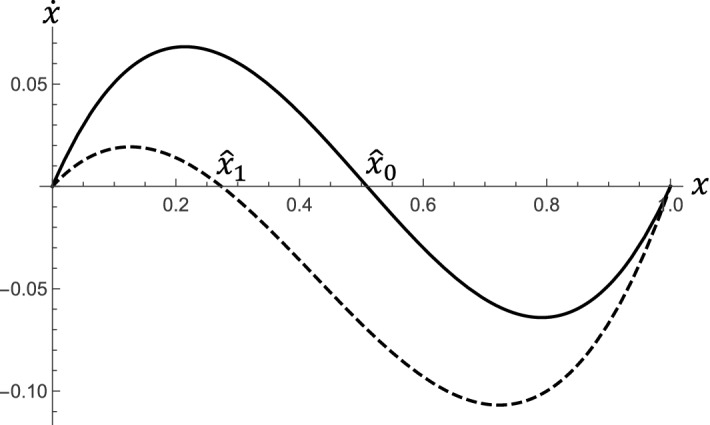
Fig. 2.

Effect of the state of emergency. Notes: The figure shows the numerical plot of drawn by solid line and drawn by dash line with parameters as follows: , , , , , , ,

Effect of the state of emergency. Notes: The figure shows the numerical plot of drawn by solid line and drawn by dash line with parameters as follows: , , , , , , ,