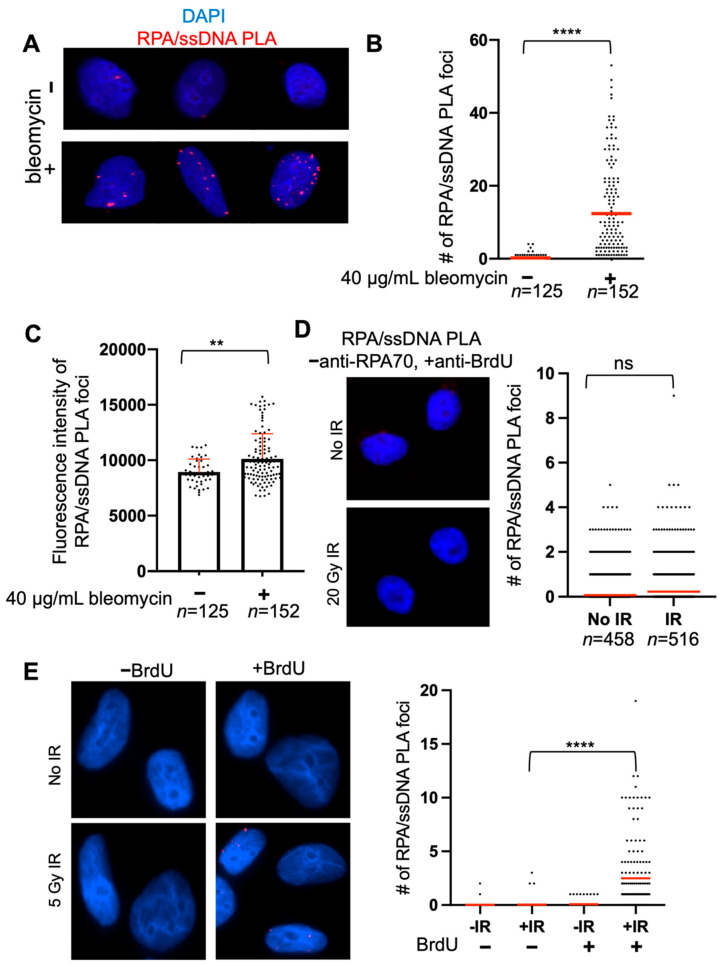
Figure 2.
Quantification of RPA/ssDNA PLA foci. (A) Representative images of RPA/ssDNA PLA foci before and 2 h after bleomycin treatment. (B) Quantification of RPA/ssDNA PLA foci per nucleus before and 2 h after bleomycin treatment. For -bleomycin condition, red line indicates mean # of PLA foci= 0.23 and % of cells with >1 PLA foci = 15%. For +bleomycin condition, red line indicates mean # of PLA foci = 12.39 and % of cells with >1 PLA foci = 76% (**** p < 0.001, t-test). (C) Quantification of fluorescence intensity of RPA/ssDNA PLA foci from (A,B). Box represents mean fluorescence (−bleomycin = 8944, +bleomycin = 10,129), red error bar indicates standard deviation (** p < 0.01, t-test). (D) Representative images and quantification of RPA/ssDNA PLA foci negative control without anti-RPA70 antibody treatment before and 2 h after 20 Gy IR. Red line indicates mean # of RPA/ssDNA PLA foci (No IR = 0.1, IR = 0.2). (E) Representative images and quantification of RPA/ssDNA PLA foci control experiment in cells with and without BrdU incorporation, before and 2 h after 5 Gy IR. Red line indicates mean # of RPA/ssDNA PLA foci (−BrdU − IR = 0.02, n = 155; −BrdU + IR = 0.05, n = 152; +BrdU − IR = 0.07, n = 127; +BrdU + IR = 2.5, n = 153) (**** p < 0.001).

