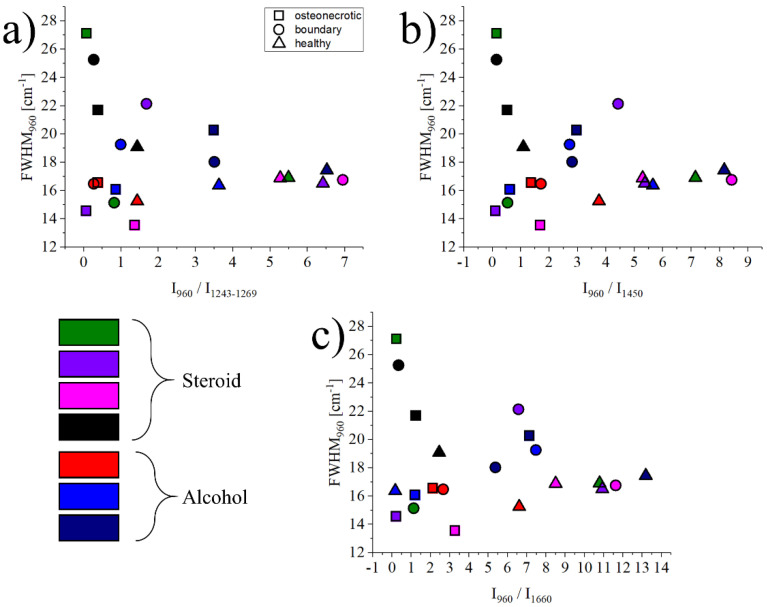
Figure 4.
Graphs showing the relationship between the intensity ratios (I960cm−1/I1243–1269cm−1, I960cm−1/I1450cm−1 and I960cm−1/I1660cm−1) and the FWHM of the band located at 960 cm−1 for the healthy, boundary and ON regions of all samples (a–c). Symbols and colors are as follows: △ healthy, □ osteonecrosis and ○ boundary tissue; green, purple, pink and black for steroid, red, blue and dark blue for alcohol.

