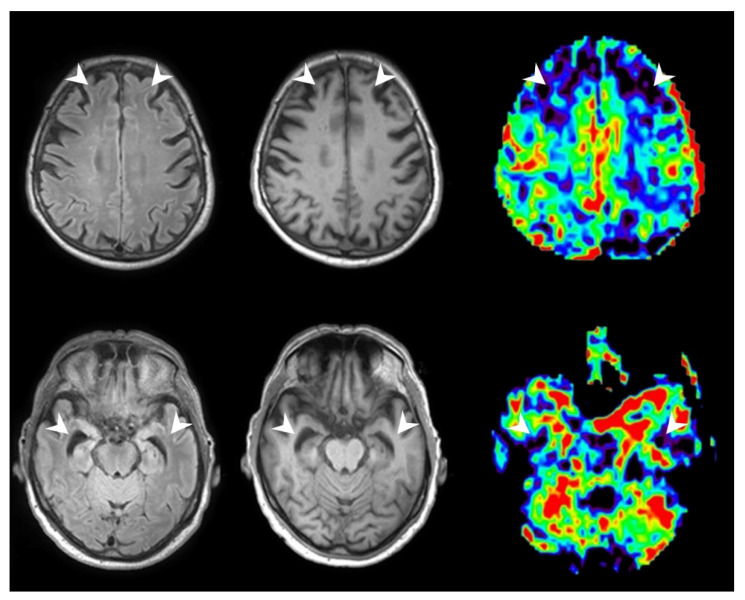
Figure 4.
A patient with diagnosed FTD and corresponding pASL perfusion maps showing reduced CBF in the frontotemporal regions. From left to right: FLAIR Sequence, T1w Sequence, pASL Sequence; perfusion data were visualized with OLEA SPHERE® 2.3 (Olea medical, La Ciotat, France)(white arrows indicating regions of atrophy and hypoperfusion).

