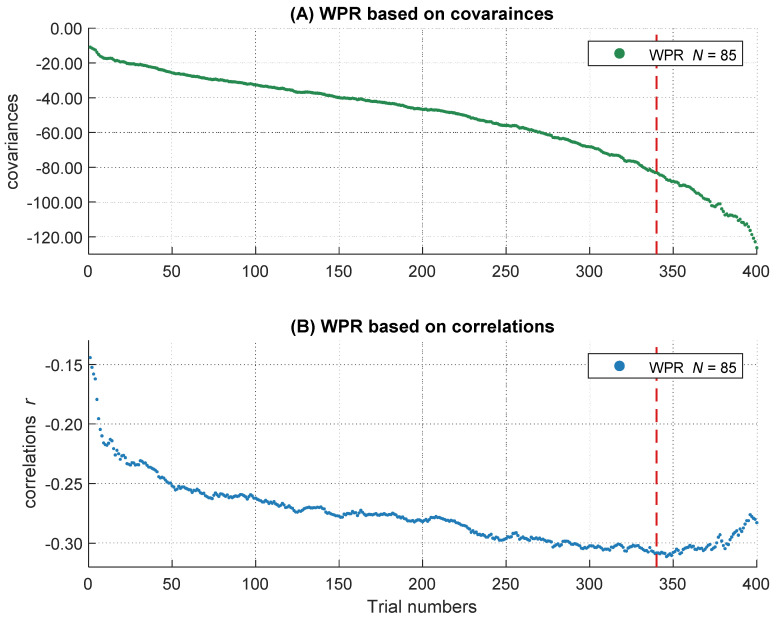
Figure 3.
The increasing magnitude of negative correlations and covariances over RT distribution. The course of the covariances over 400 trials is shown above (A), the course of correlations over 400 trials is shown below (B). The dashed line represents the 85 percent threshold. Only the left part of the red dashed line was analyzed in the following multi-level analyses.

