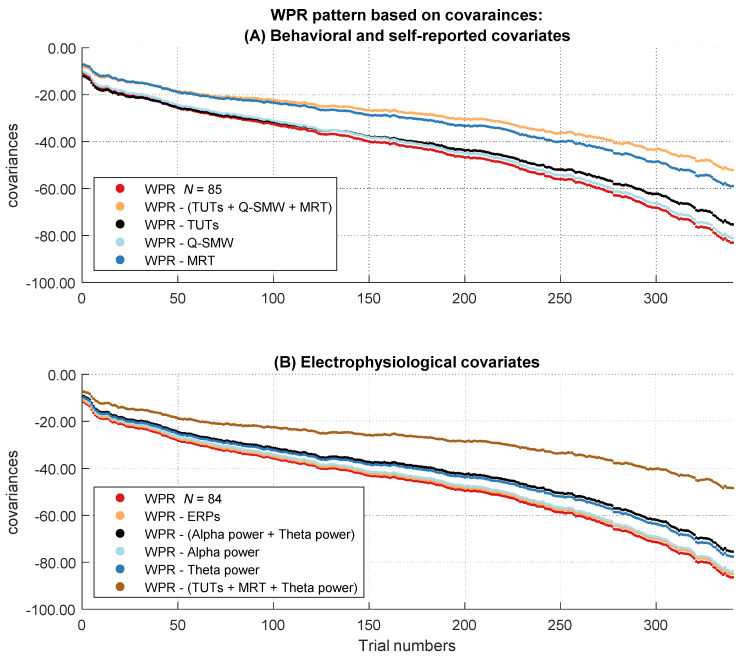
Figure 4.
Course of the covariances over the RT distribution before and after controlling for the influence of the attentional lapses covariates. The figure describes the worst performance pattern in covariances before (red lines) and after (other lines) the different covariates or their combinations were partialized out of the RT variable (labeled in the boxes on the side of the dashes in the figure legend). (A) shows the results of the behavioral and self-reported covariates in the full sample of N = 85. (B) shows the results of the electrophysiological covariates in the subsample of N = 84.

