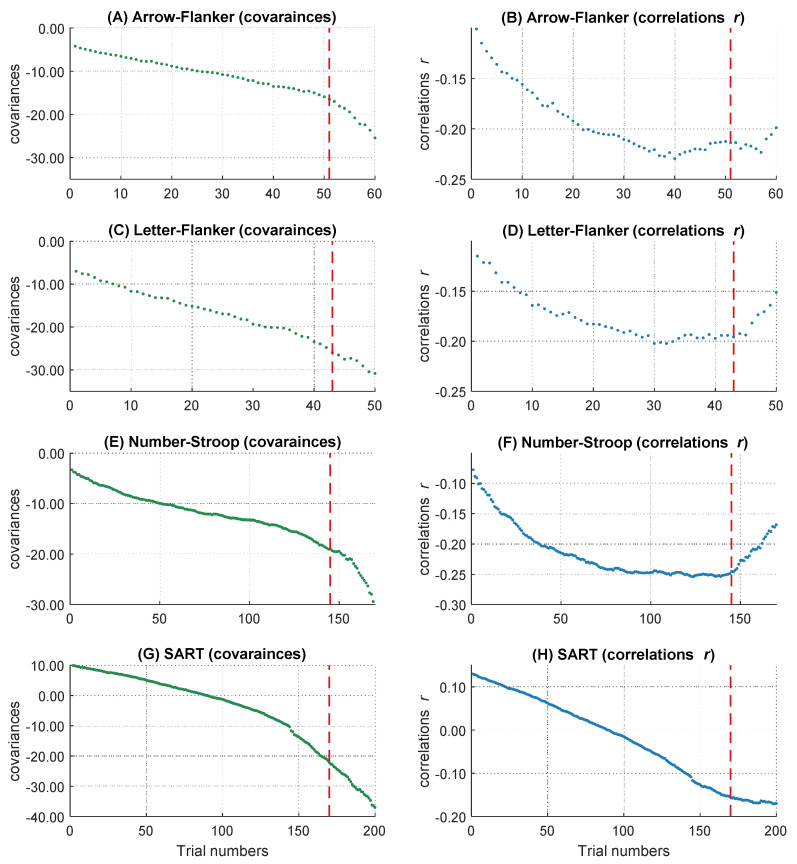
Figure 6.
The increasing magnitude of negative correlations and covariances over RT distributions. The courses of the covariances in the four different tasks are shown on the left side (A,C,E,G). The courses of the correlations in the four different tasks are shown on the right side (B,D,F,H). The dashed lines represent the 85 percent thresholds. Only the left parts of the dashed lines were analyzed in the following multi-level analyses.

