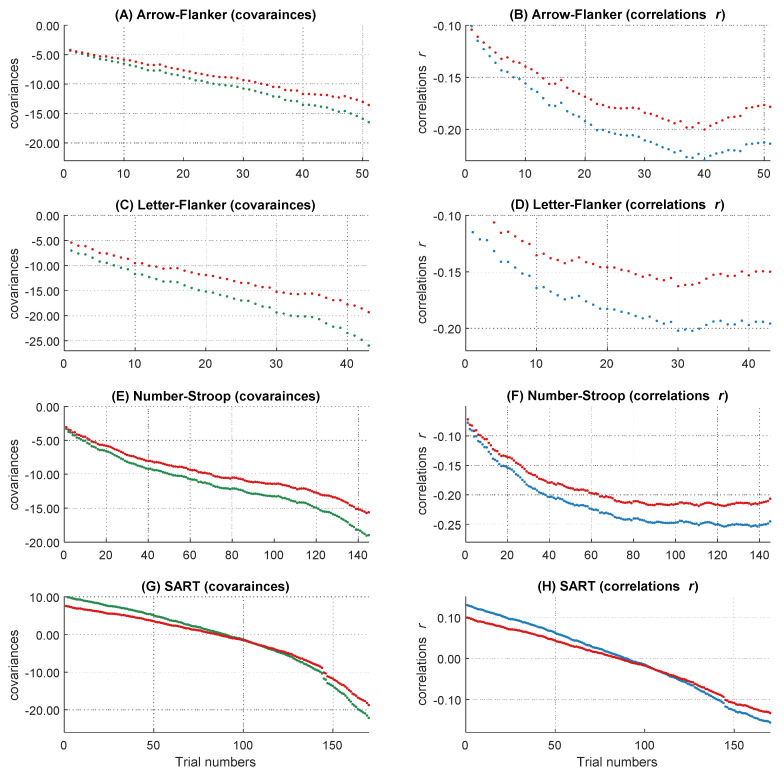
Figure 7.
Course of the covariances and correlations over the RT distributions before and after controlling for the influence of the attentional lapses covariates. The courses of the covariances in the four different tasks are shown on the left side (A,C,E,G). The courses of the correlations in the four different tasks are shown on the right side (B,D,F,H). The figure describes the worst performance pattern before (green and blue lines) and after (red lines) the TUTs covariate were partialized out of the covariance.

