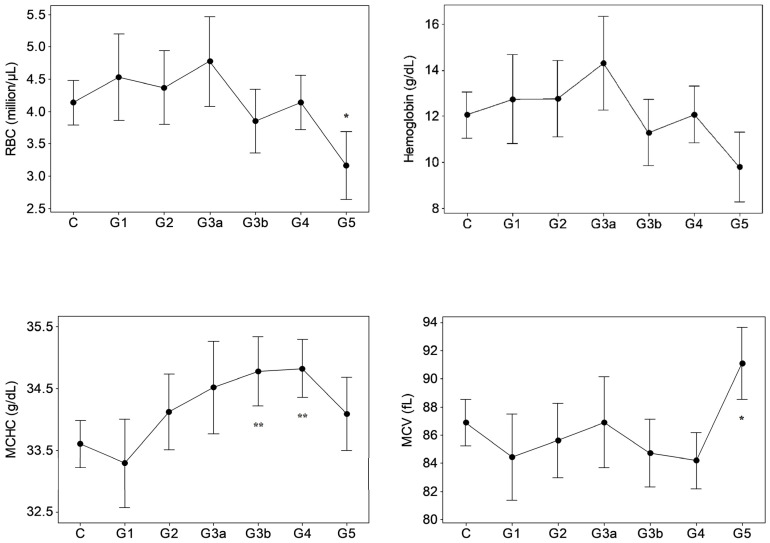
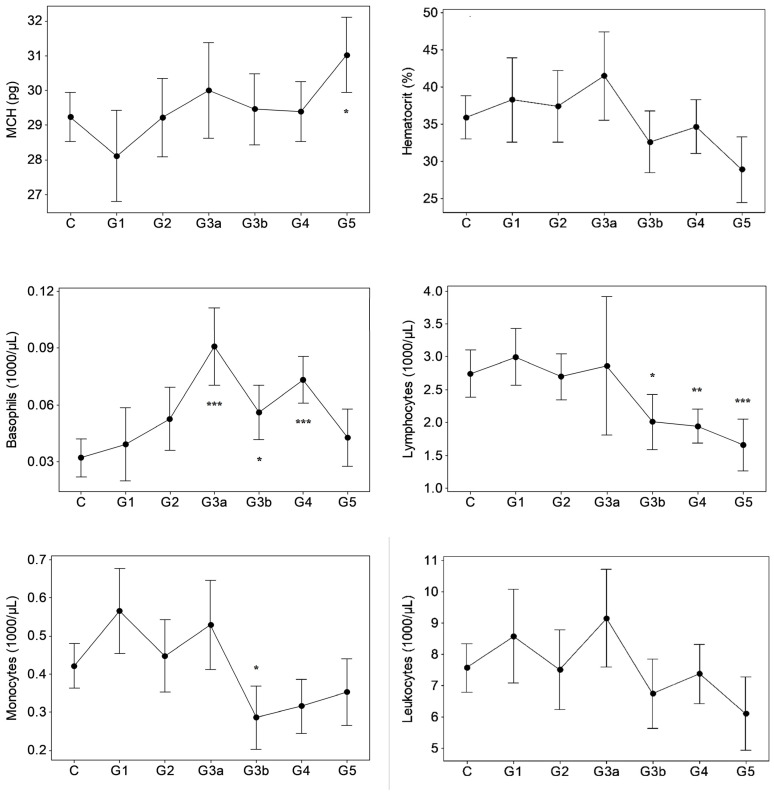
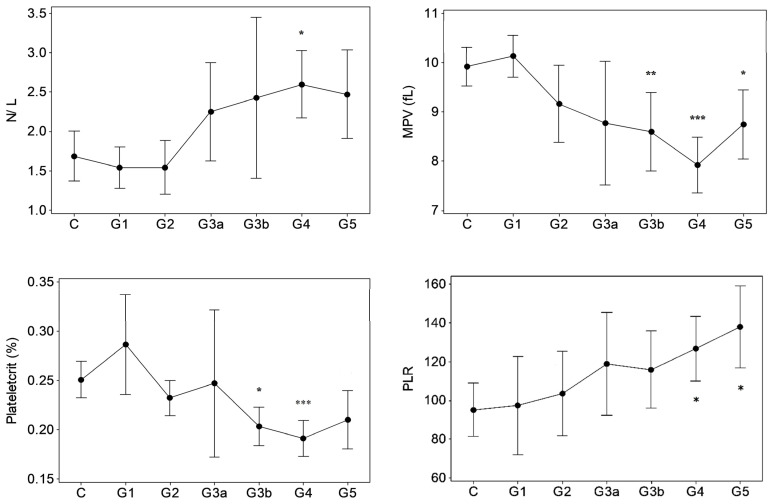
Figure 1.
Hematological variations in proteinuric CKDu progression. n = 38–41, 11, 15, 10, 18–20, 26–27, 16–18 in C (control) and G1–G5 (CKD staging) respectively. Data presented as mean and 95% confidence interval. * p < 0.05, ** p < 0.01, *** p < 0.001 compared to control (one way ANOVA, Dunnett’s MRT). Plots with no asterisk: p < 0.05 by ANOVA and p > 0.05 by Dunnett’s MRT. RBC: red blood cells, MCMC: mean corpuscular hemoglobin concentration, MCV: mean corpuscular volume, MCH: mean corpuscular hemoglobin, N/L: neutrophil to lymphocyte ratio, MPV: mean platelet volume, PLR: platelet to lymphocyte ratio.


