
Figure 5.
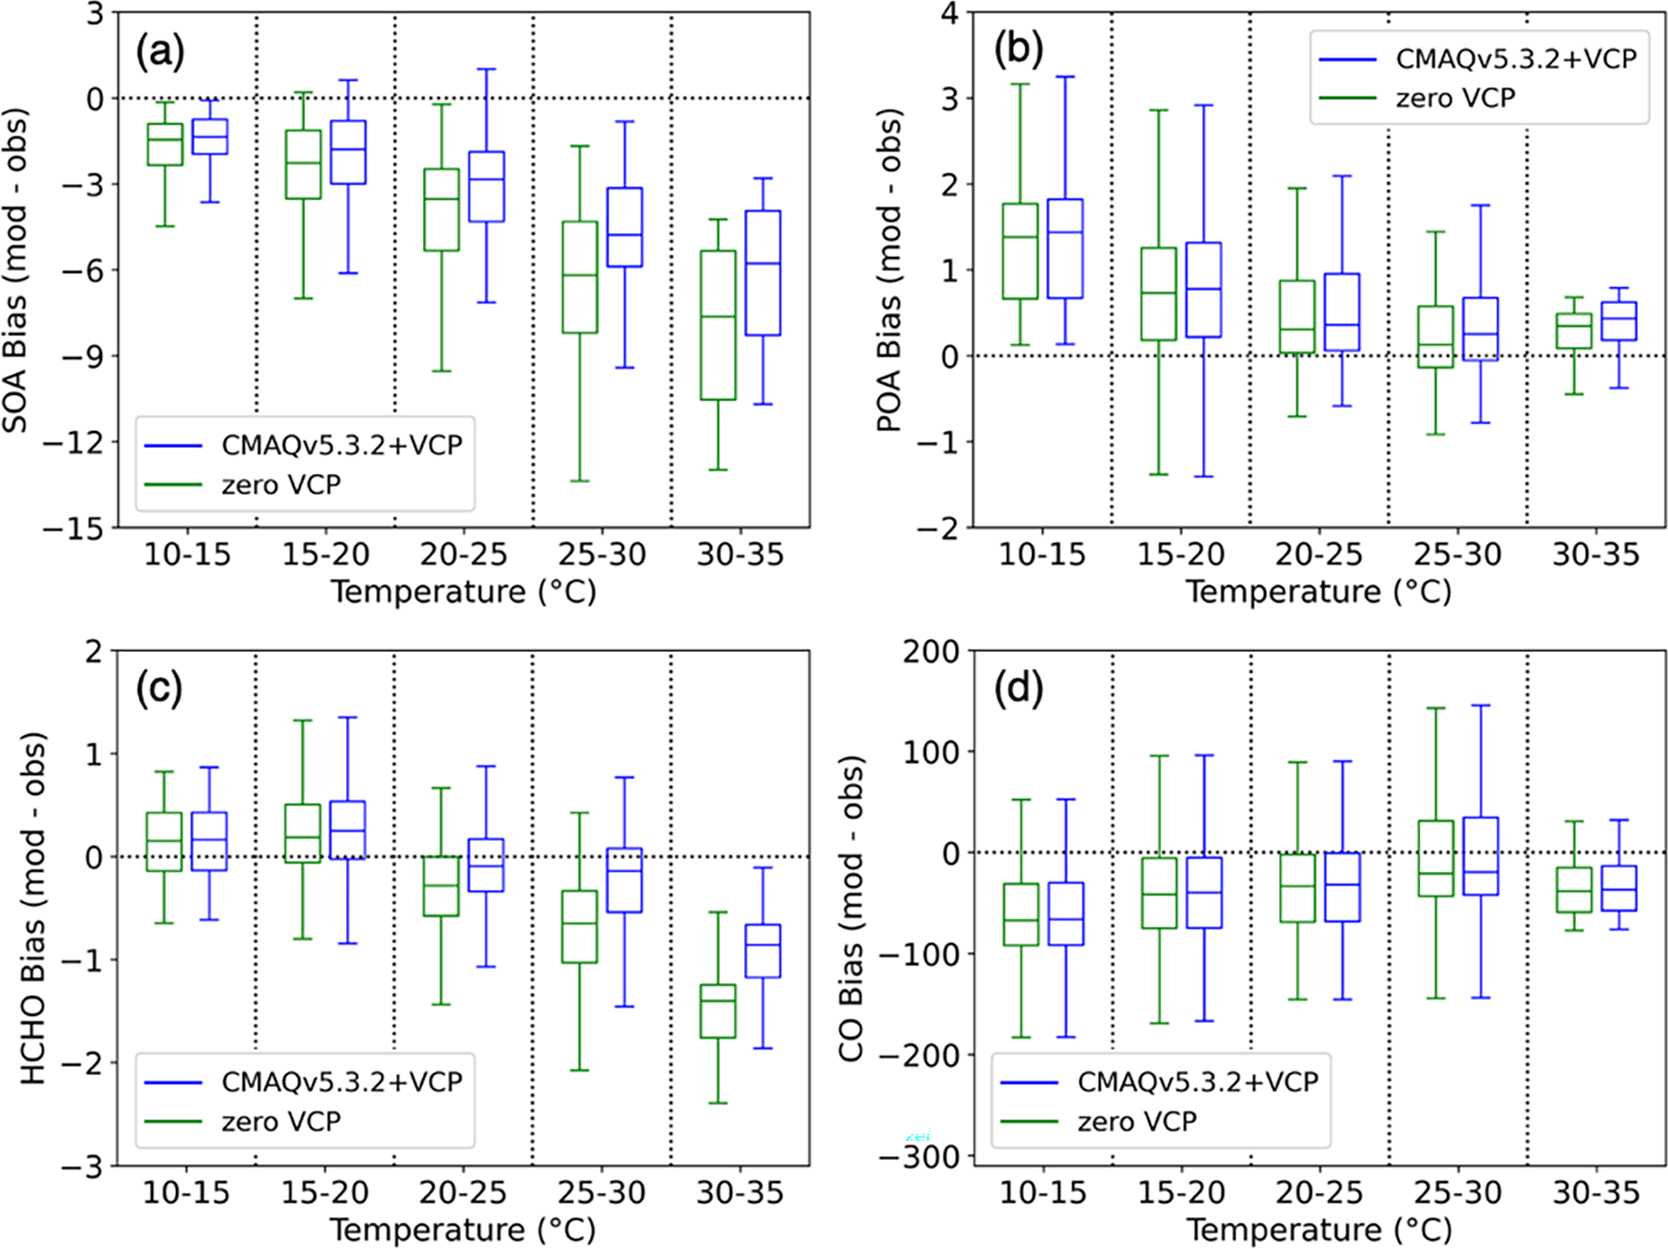
Bias (modeled - observed) of hourly concentrations vs. modeled temperature for the zero VCP case (green) and CMAQv5.3.2+VCP case (blue). Hourly concentrations are binned into five temperature ranges of 5°C each and the data in each bin is represented by a box-and-whisker plot. The horizontal midline depicts the median of the data, the edges of the box extend from the lower to upper quartile of the data, and the whiskers extend from the minimum to the maximum of the data. a) PM1 SOA bias (μg m−3). b) PM1 POA bias (μg m−3). c) Formaldehyde (HCHO) bias (ppb). d) CO bias (ppb).