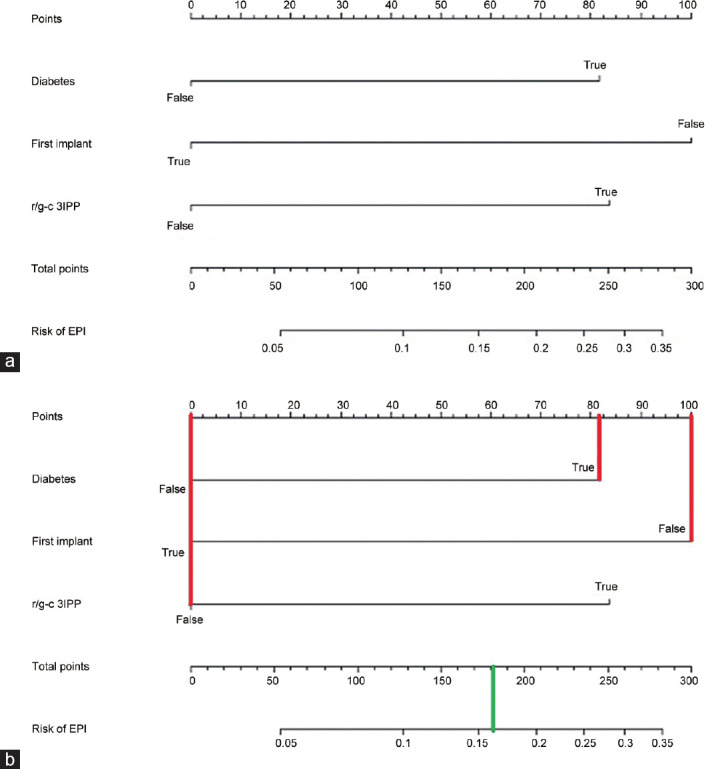
Figure 1.

(a) Nomogram for predicting EPI onset after penile prosthesis implantation. The value for each factor (diabetes, first implant, r/g-c 3IPP) corresponds to points vertically above on the top scale. Point values are added together to determine the total points, which is directly connected to the odds of having EPI after surgery. Instructions for readers: in diabetic patients, draw a line from “Diabetes” axis straight upward to the point axis to determine how many points he receives for this comorbidity. Repeat the process for each additional variable. Sum the points for each of the predictors. Locate the final sum on the total point axis. Draw a line straight down to find the patient's probability of EPI. (b) Clinical example. Redo surgery in diabetic patient who has been scheduled for a malleable prosthesis implant: draw a vertical line (in red) for each of the variables of your patient (diabetes “Yes”= 82 points; first implant “NO” = 100 points, r/g-c 3IPP “NO” = 0 points); then you sum up the three values you read on the Points scale (82 + 100 + 0 = 182) to obtain total points. Finally, you draw a vertical line (in green) on the total points scale (182) to read the risk of EPI (0.16; 16%). EPI: early prosthetic infection; r/g-c 3IPP: rifampicin/gentamicin-coated 3-piece inflatable penile prosthesis.
