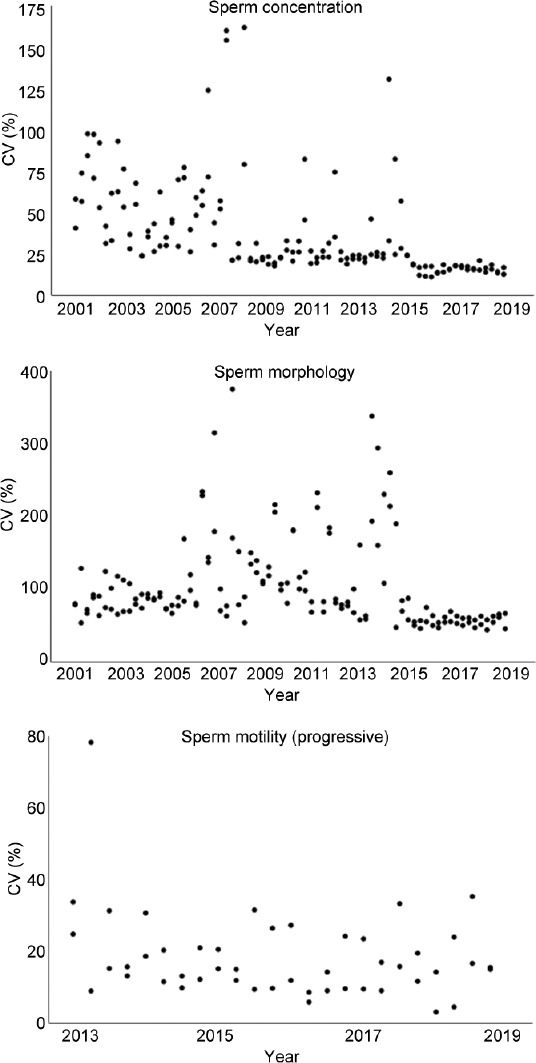
Figure 1.

Overview of the CV of the EQC program results for each semen parameter. EQC consisted of four distributions each year with two samples per distribution. Each dot represents the CV (in %) of one EQC sample between 2001 and 2018 (sperm concentration and morphology, respectively) and between 2013 and 2018 (sperm motility). CV: coefficient of variation; EQC: external quality control.
