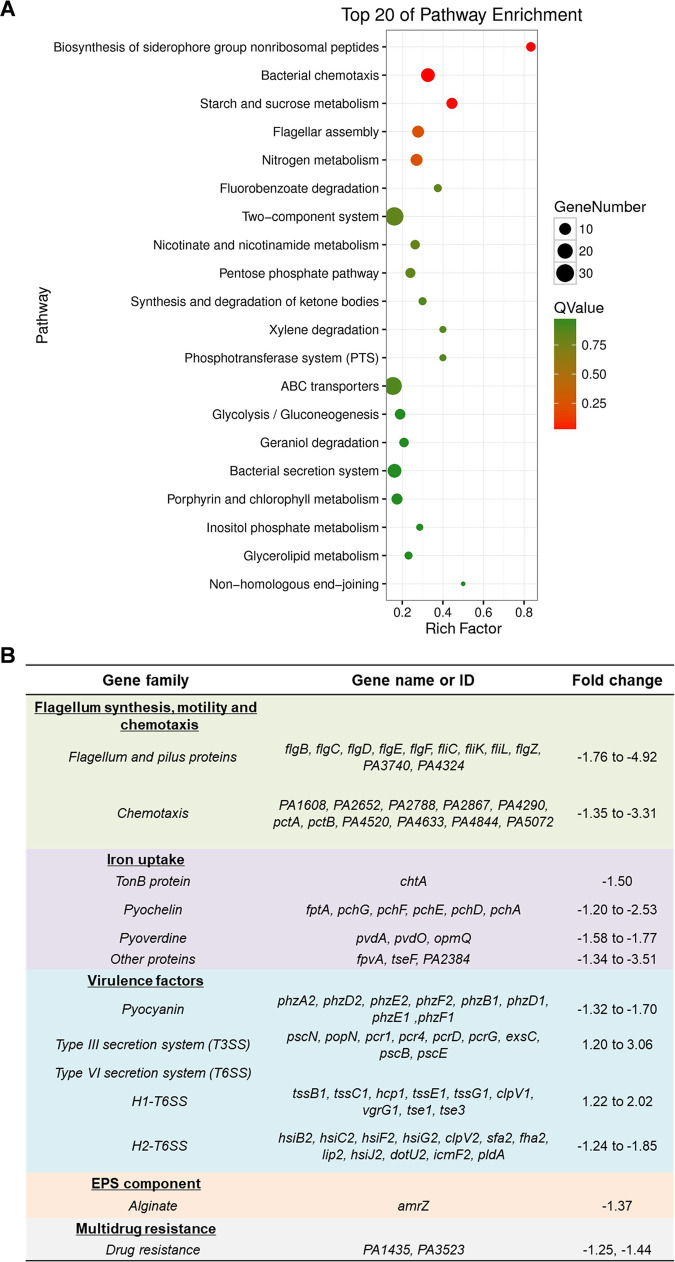
FIG 1.
FleS/FleR regulates multiple physiological pathways in PAO1. (A) KEGG-enrichment of differentially expressed genes identified in the RNA-seq analysis. The y axis represents the names of the pathways. The x axis represents the rich factor which refers to the ratio of the number of differentially expressed genes to the total number of genes in the pathway. The size of the dot represents the number of differentially expressed genes in the pathways, and the color of the dot represents different Q values. The higher the value of rich factor represents the greater the enrichment degree. The smaller the Q value represents the more significant the enrichment. (B) Selected gene families related to bacterial virulence and drug resistance with more than 1.2-log2fold changes owing to the deletion of fleR in PAO1 (ΔfleR versus PAO1 WT).

