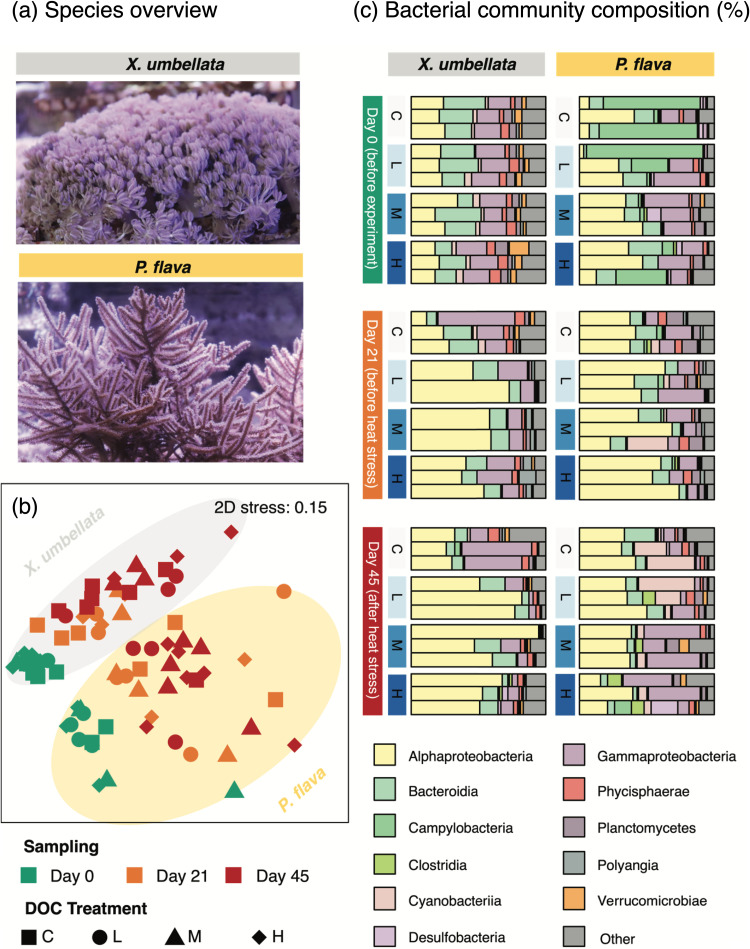
FIG 2.
Bacterial community compositions of corals X. umbellata and P. flava over the course of the experiment. (a) Representative photographs of corals. (b) Non-metric multidimensional scaling (NMDS) plot based on Bray-Curtis dissimilarity matrix of bacterial community compositions associated with coral samples at day 0, day 21, and day 45. (c) Stacked bar plots of bacterial community compositions of corals across different time points and DOC treatments. Stacked bar plots display the 10 most abundant bacterial classes (>1%, determined for each coral species separately).

