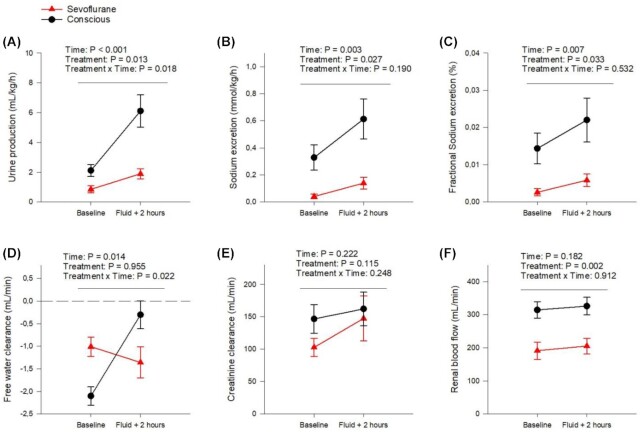
Figure 4.
Renal excretory function and blood flow in conscious and sevoflurane anesthetized sheep. Urine output (mL/kg/h) (A), sodium excretion (mmol/kg/h) (B), fractional sodium excretion (%) (C), free water clearance (mL/min) (D), body surface area adjusted creatinine clearance (mL/min) (E) and RBF (mL/min) (F) in conscious sheep (filled black connected circles) compared with the same sheep under sevoflurane anesthesia ((filled red connected triangles). Comparisons were made at baseline and 2 h after an intravenous fluid load with 20 mL/kg Ringer's acetate solution infused over 30 min. Data are presented as mean ± SEM with the significance level set as P < .05. Changes in parameters over time were analyzed according to a two-way repeated-measures ANOVA, the repeating variables being time and treatment (anesthesia/conscious). Changes over time were interpreted as an effect of the fluid bolus and differences in treatment as an effect of sevoflurane anesthesia. A significant interaction between time and treatment was interpreted as an effect of sevoflurane anesthesia on the response to fluid loading. Creatinine clearance was calculated as urinary flow in mL/min * U-crea/P-crea, and then normalized according to body surface area. CH2O was calculated as urinary flow in mL/min—((U-osm/P-osm) * urinary flow in mL/min). FENa was calculated as (P-crea * U-Na)/(P-Na * U-crea), all in mmol/L. Renal vascular resistance was calculated as (MAP-CVP)/RBF. N = 7.

