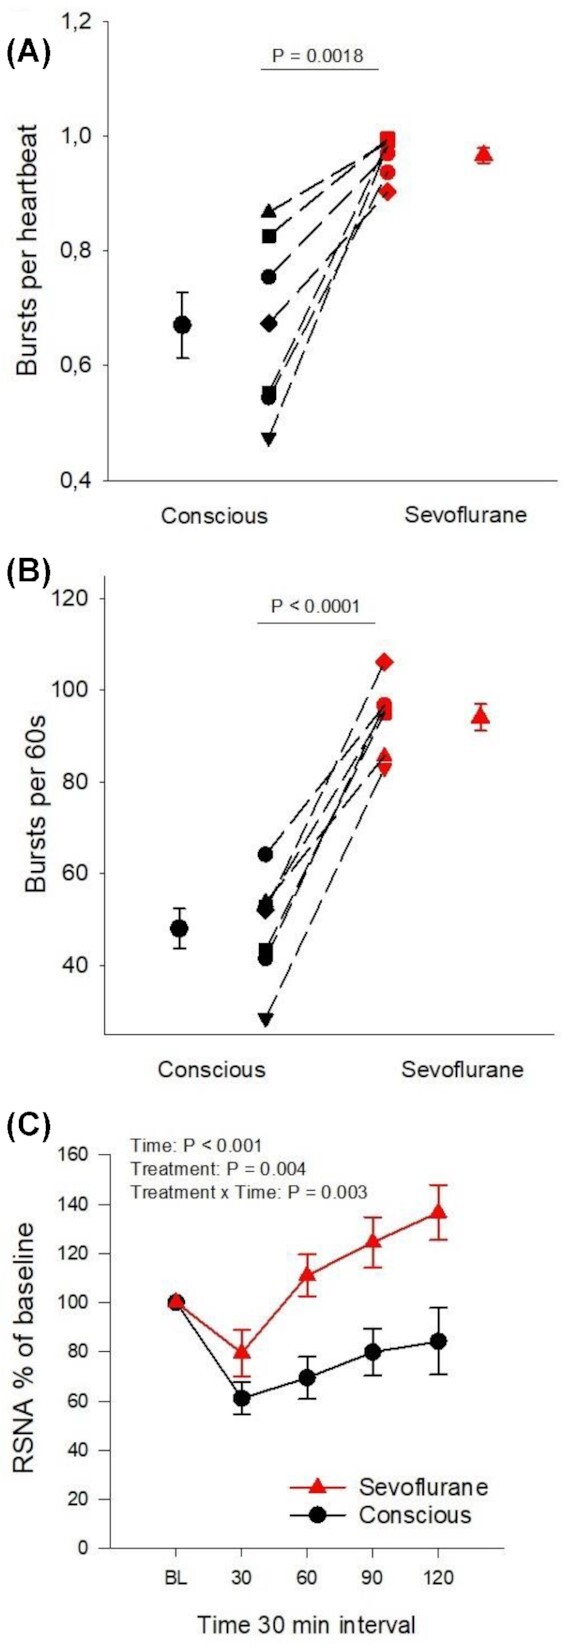
Figure 5.

Comparative RSNA analysis in conscious and sevoflurane anesthetized sheep (A) Burst count per heartbeat at baseline, (B) Burst count per minute at baseline, and (C) change in integrated RSNA voltage as percentage from baseline after fluid load of Ringer's acetate solution (20 mL/kg over 30 min) in sevoflurane anesthetized (filled red symbols) and conscious (filled black symbols) sheep. Dashed lines in (A) and (B) connect symbols for individual sheep in the different experiments. Mean values are displayed with bars for standard error of the mean. Differences between the conscious state and sevoflurane anesthesia were analyzed with within-subject pairwise comparisons using Student's paired t-test (P-value in figures A and B). Changes in parameters over time in C) were analyzed according to a two-way repeated-measures ANOVA using time-points 30 and 120, the repeating variables being time and treatment (anesthesia/conscious). Changes over time were interpreted as an effect of the fluid bolus and differences in treatment as an effect of sevoflurane anesthesia. A significant interaction between time and treatment was interpreted as an effect of sevoflurane anesthesia on the RSNA-response to fluid loading (Treatment x Time: P-value in C). The significance level was set as P < .05.
