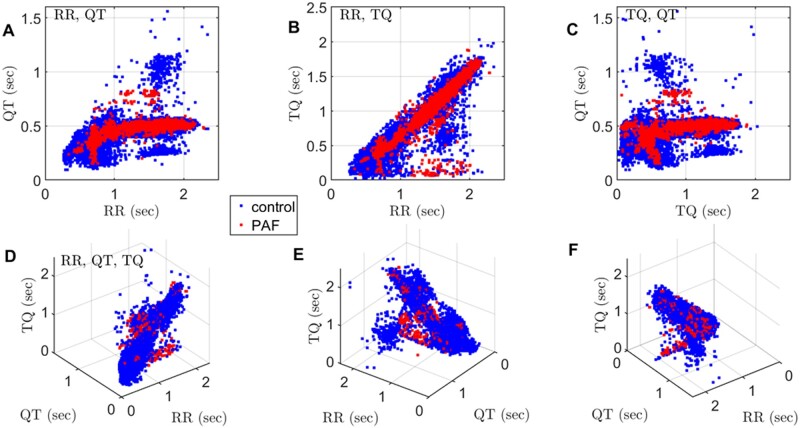
Figure 3.
ECG restitution analysis using two and three parameters simultaneously. Each dot represents an individual heartbeat; blue for controls and red for cases (PAF). The total number of analyzed heartbeats is 43 331 (34 861 from control and 8470 from PAF). (A) Dependence of the action potential duration (represented by QT interval) on the basic cycle length (RR interval). (B) Dependence of the diastolic interval (represented by TQ interval) on the basic cycle length (RR). (C) Dependence on the action potential duration on the diastolic interval. (D–F) Snapshots of data at different angles reveal a complex interdependence between all three parameters used for restitution analysis.

