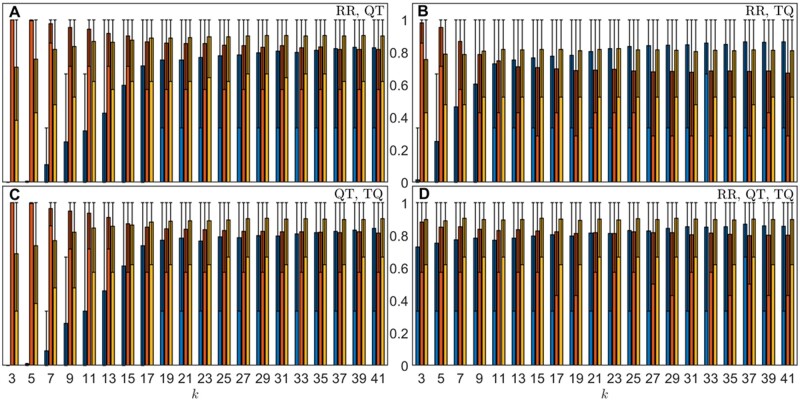
Figure 5.
Results using majority votes on all records in each animal, over 1000 repeated random cross-validation runs. Each run uses randomly selected 48 controls and 7 PAF horses for training set and 7 controls and 3 PAF horses for validation set out of 55 controls and 10 cases. Blue bars show the mean TPRs; red bars show the mean TNRs; yellow bars show the mean AUCs. The error bars show the corresponding 2.5th and 97.5th percentile of the metrics.

