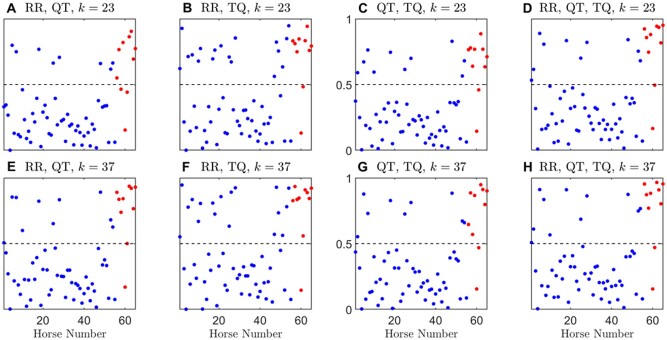
Figure 8.
Posterior probability of using majority votes on all records in each animal, over 1000 repeated random cross-validation runs, for k = 23, 37. Subjects belong to the control class are denoted by blue solid dots and PAF class by red solid dots. Results were averaged over 1000 random cross-validation runs. Dashed line indicates the majority vote threshold which is at 0.5.

