FIG 3.
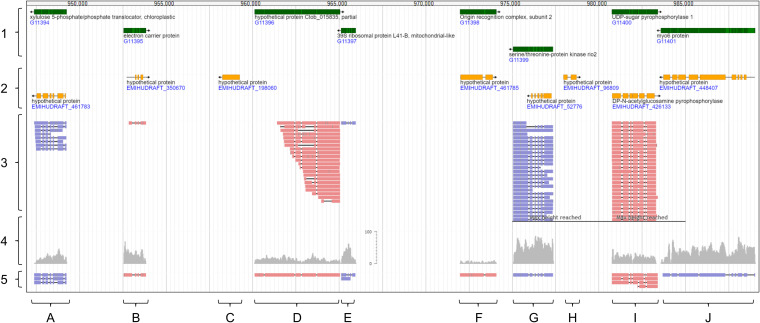
E. huxleyi CCMP3266 genes were generated by clustering transcript isoforms into gene loci. Visualized is a representative region of the E. huxleyi CCMP3266 sGenome (CCMP1516 reference genome plus CCMP3266-specific gene constructs). The visualization includes newly generated CCMP3266 gene annotations (left, track 1) and CCMP1516 gene annotations downloaded from NCBI (track 2). Bottom characters indicate gene loci discussed in the main text. The visualization includes alignments generated for PacBio CCS reads (track 3), Illumina QC reads (track 4), and contigs of the hybrid transcriptome (track 5). Track 4 is depicted as coverage track (light gray) with numbers on the scale indicating how often a read mapped to a specific position. Tracks 3 and 5 show individual transcripts (light red, + strand; light blue, – strand). The visualization was done with JBrowse (69), using the E. huxleyi CCMP3266 sGenome as reference (aee Data Sets S4 and S5).

