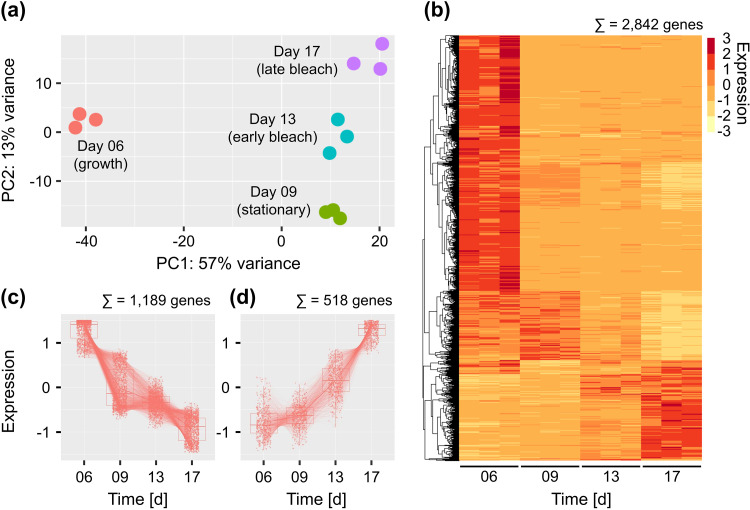
FIG 5.
Changes in E. huxleyi CCMP3266 gene expression patterns are most pronounced during the transition from growth to stationary phase. (a) A principal component analysis plot of algal gene expression in the different samples indicates that biological triplicates cluster closely together. The transition from growth (day 6) to stationary phase (day 9) is accompanied by global changes in gene expression, illustrated by the distance between the time points on the PC1 axis. Smaller differences in gene expression are observed during the transition from stationary phase to the early and late bleaching phase (days 9 to 17). (b) A heatmap with 2,842 differentially expressed genes (DEG) reveals clusters of E. huxleyi CCMP3266 genes that are characteristic for the different algal life phases. (c and d) Clusters of 1,189 downregulated (c) and 518 upregulated (d) DEGs were identified for subsequent GO enrichment analysis. Gene expression values are shown as z-scores. DEGs and down- and upregulated genes are indicated in Data Set S2 (columns 11 to 13).

