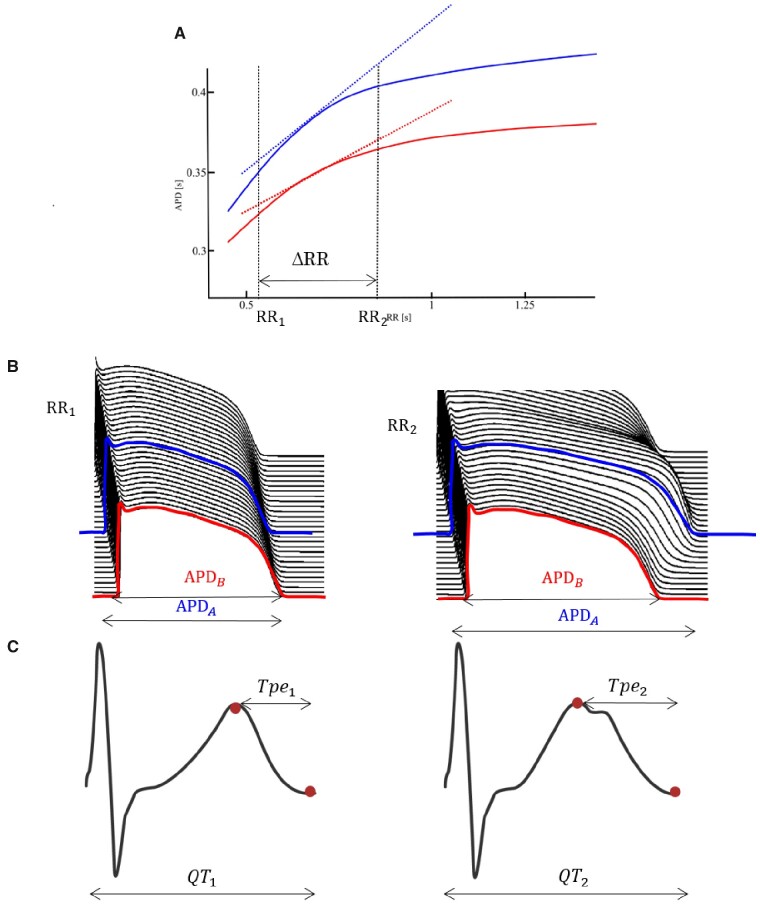
Figure 1.
Electrical Restitution. (A) Two APD restitution curves, depicting the APD as a response to the preceding RR interval, of two cardiomyocytes, A (blue) and B (red, B). The slope of the APD restitution curve measures the change in APD with respect to a change in RR, and high values have been associated with increased arrhythmogenic predisposition. These changes in the APD are reflected on the ECG signal, as shown in (C).

