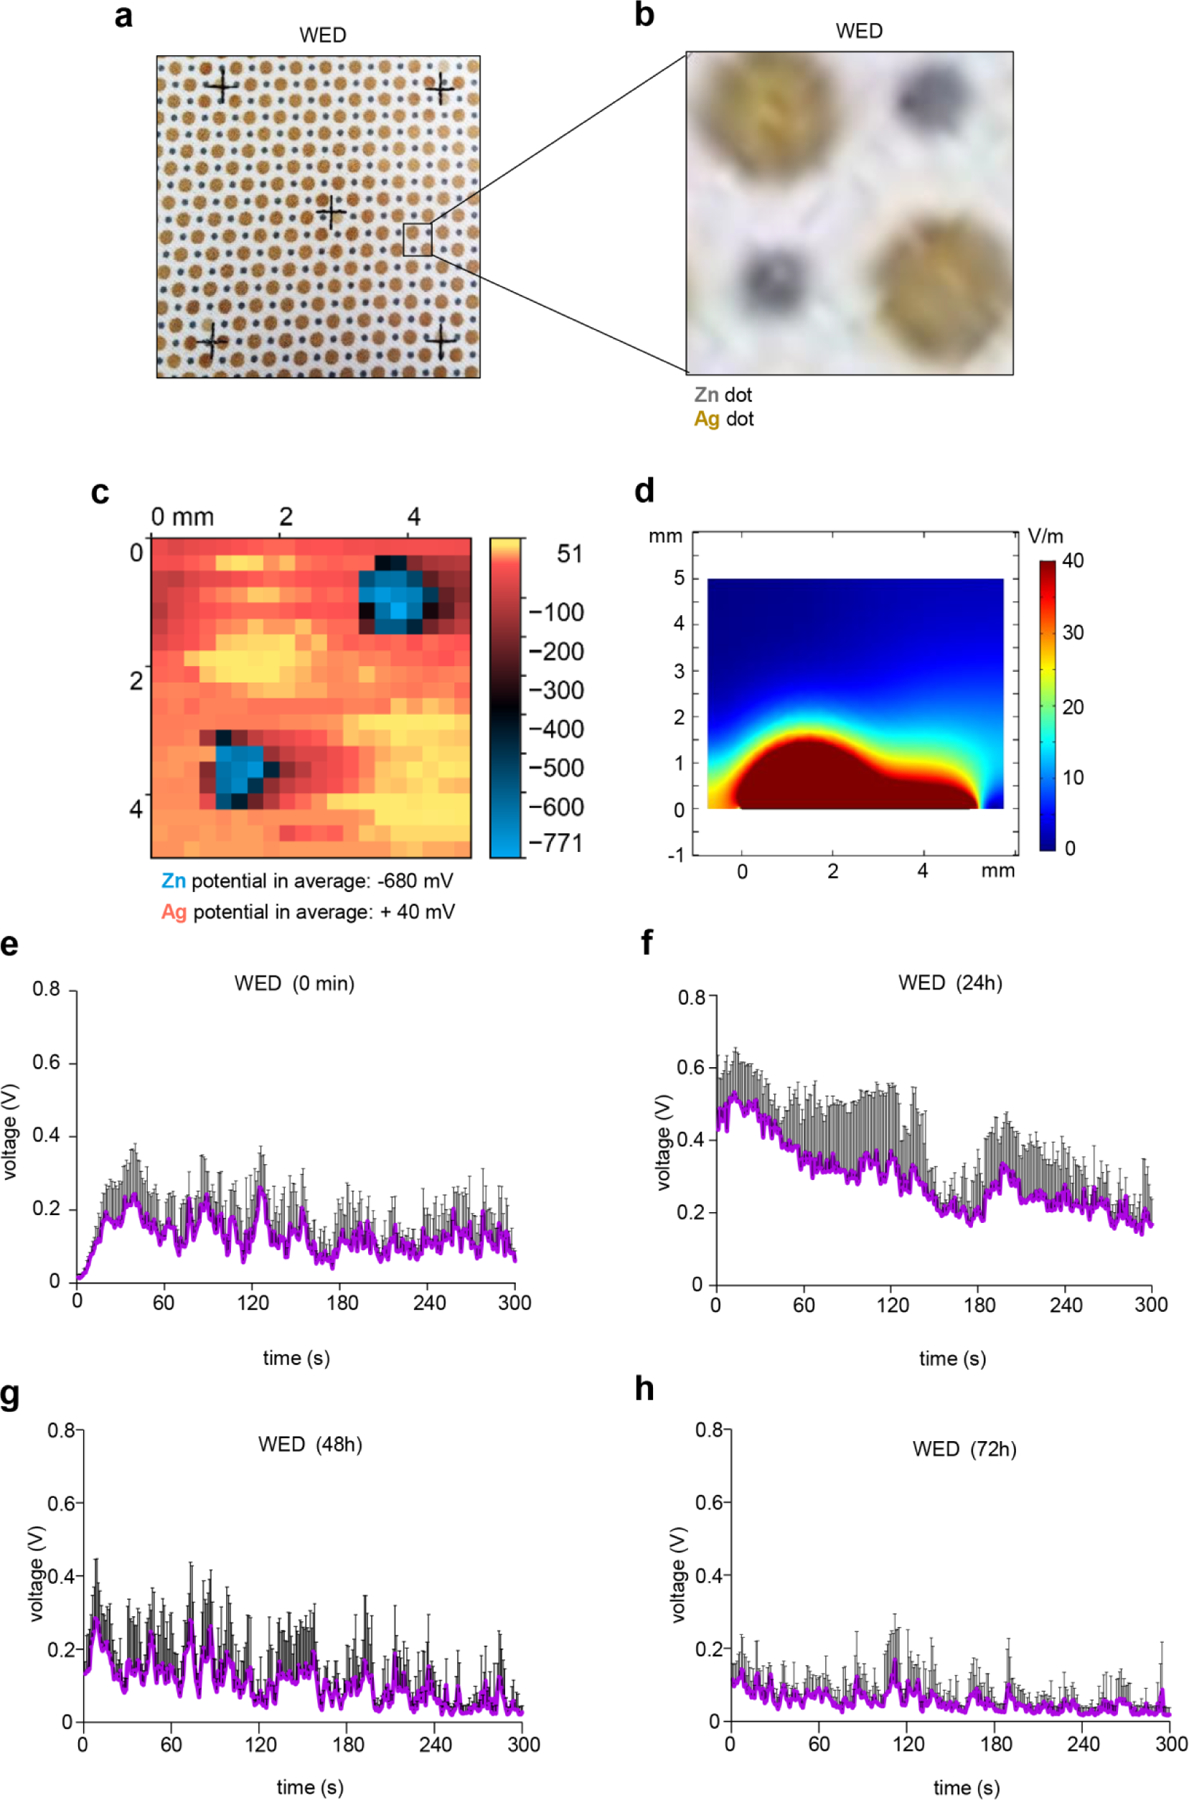
Figure 1: Electroceutical fabric as source of weak electric fields.

(a) Photomicrograph of WED. (B) Zoomed in image of a region of interest on WED corresponding to arrangement of silver and zinc dots. (c) Two-dimensional surface potential map of a region similar to (b) of the dressing in presence of YPD broth. The averaged potentials of Zn and Ag were measured as −680 mV and +40 mV, respectively. (d) Calculated E-field map from FEM simulations in perpendicular direction from WED fabric surface showing 3 mm above the fabric has E-field of 5 V/m. A slice of the field values was selected that crossed both a Ag and Zn electrode. (e) – (h) Voltage measurements for WED. Voltage generated by WED was measured using the Amprobe multimeter in presence of YPD broth. The multimeter probes were placed on adjacent Ag and Zn dots. At 0s, 200 microliters of YPD broth was added to the respective fabric and DC voltage was measured. Further, voltage measurements were recorded for these fabrics after incubation in YPD broth for 24h, 48h and 72h. n = 4. Data are represented as the mean ± SD.
