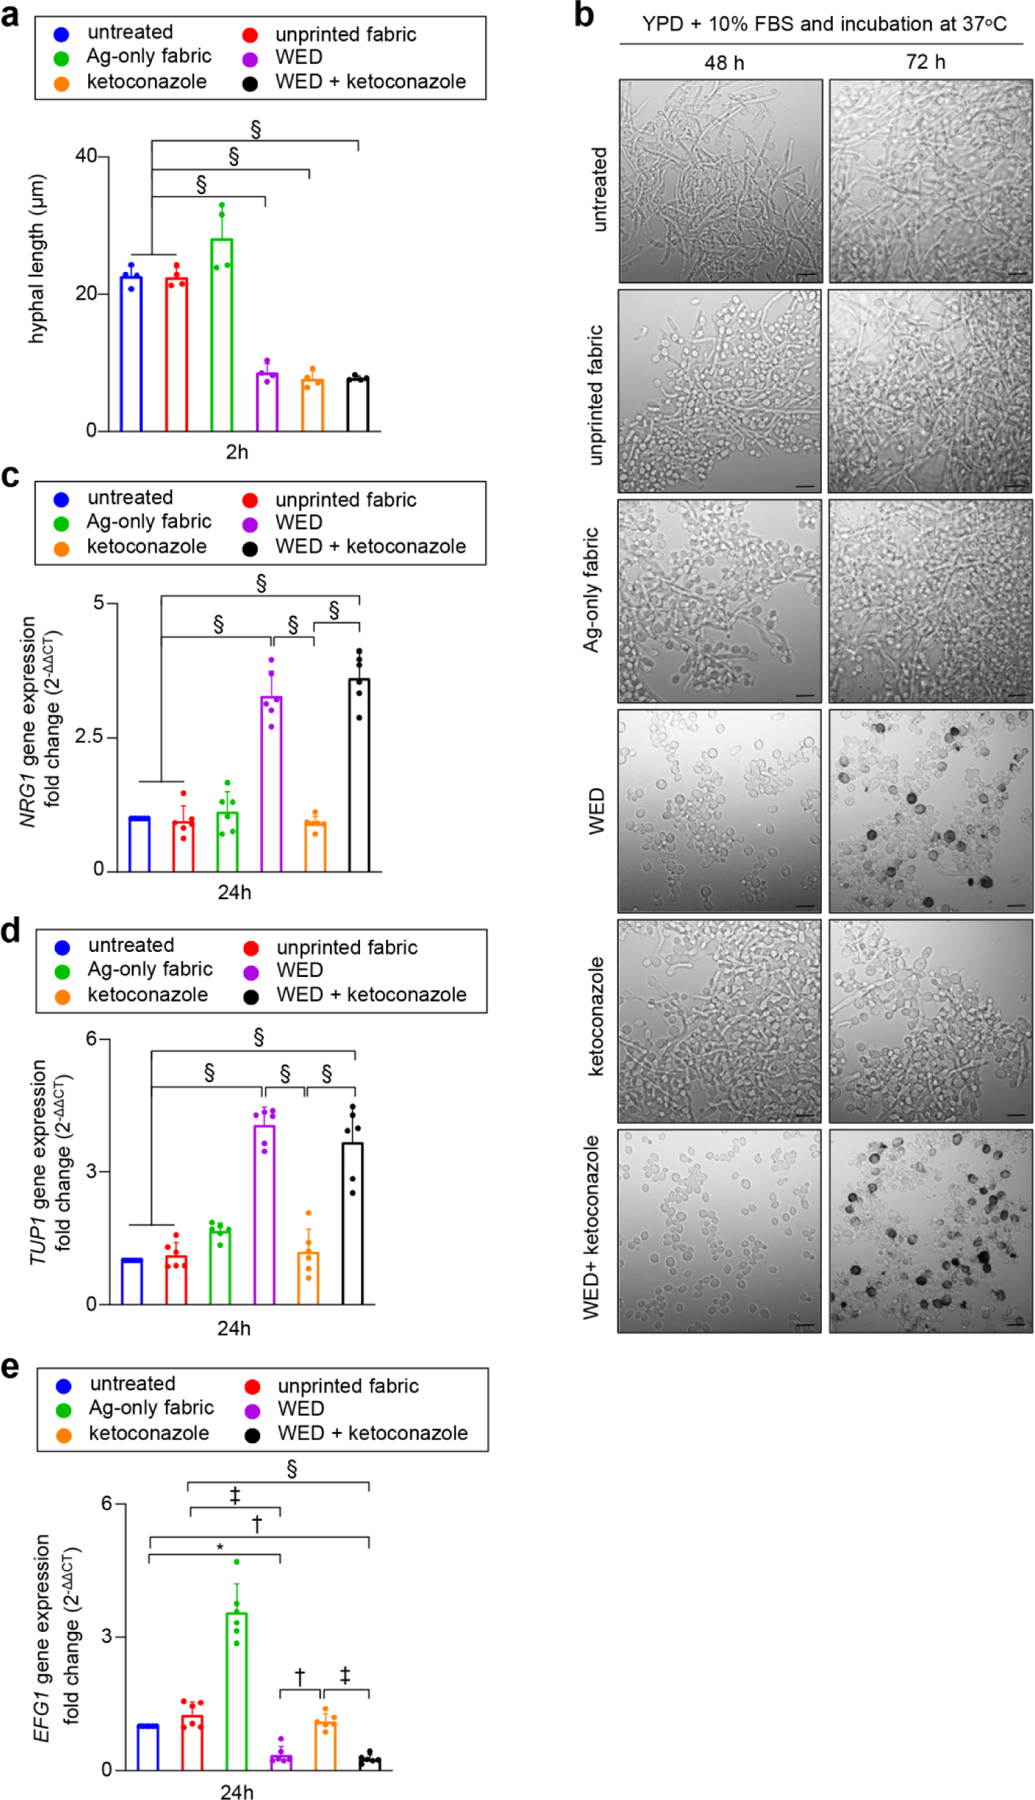
Figure 3: WED inhibited inducible hyphal transition in Candida albicans.

(a) Hyphal length assessment. Candida albicans cells (untreated or with respective treatments) were cultured in hyphae inducing condition (YPD broth with 10% FBS and incubated at 37°C) for 2h, followed by microscopic observation and image capture at 20X. These images were used to measure hyphal lengths with AccuView software. n = 4 biological replicates (40–70 hyphae measured per experimental group per replicate). §P ≤ 0.0001 (One-way ANOVA followed by post-hoc Sidak multiple comparison test). (b) Representative images for inhibitory effect of WED on inducible hyphal transition. Candida albicans were cultured in in hyphae inducing condition. After 48 and 72h an aliquot from each sample was observed at 63X magnification. Scale bar represents 5 µm. (c) – (e) Quantitative real-time PCR analysis for yeast to hyphal transition pathway related genes – NRG1, TUP1 and EFG1. C albicans cells were cultured in hyphae inducing medium (all six experimental groups) for 24h at 37ᴼC. RNA was extracted from these cells and cDNA was prepared. Real time PCR analysis was performed for transcripts: NRG1, TUP1 and EFG1 with aforementioned cDNA. Candida albicans actin gene (ACT1) was used as a housekeeping control. Expression levels were quantified employing the 2 (−ΔΔct) relative quantification method. n = 6. §P < 0.0001, ‡P < 0.0005 and *P < 0.05 (One-way ANOVA followed by post-hoc Sidak multiple comparison test). Data are represented as the mean ± SD.
