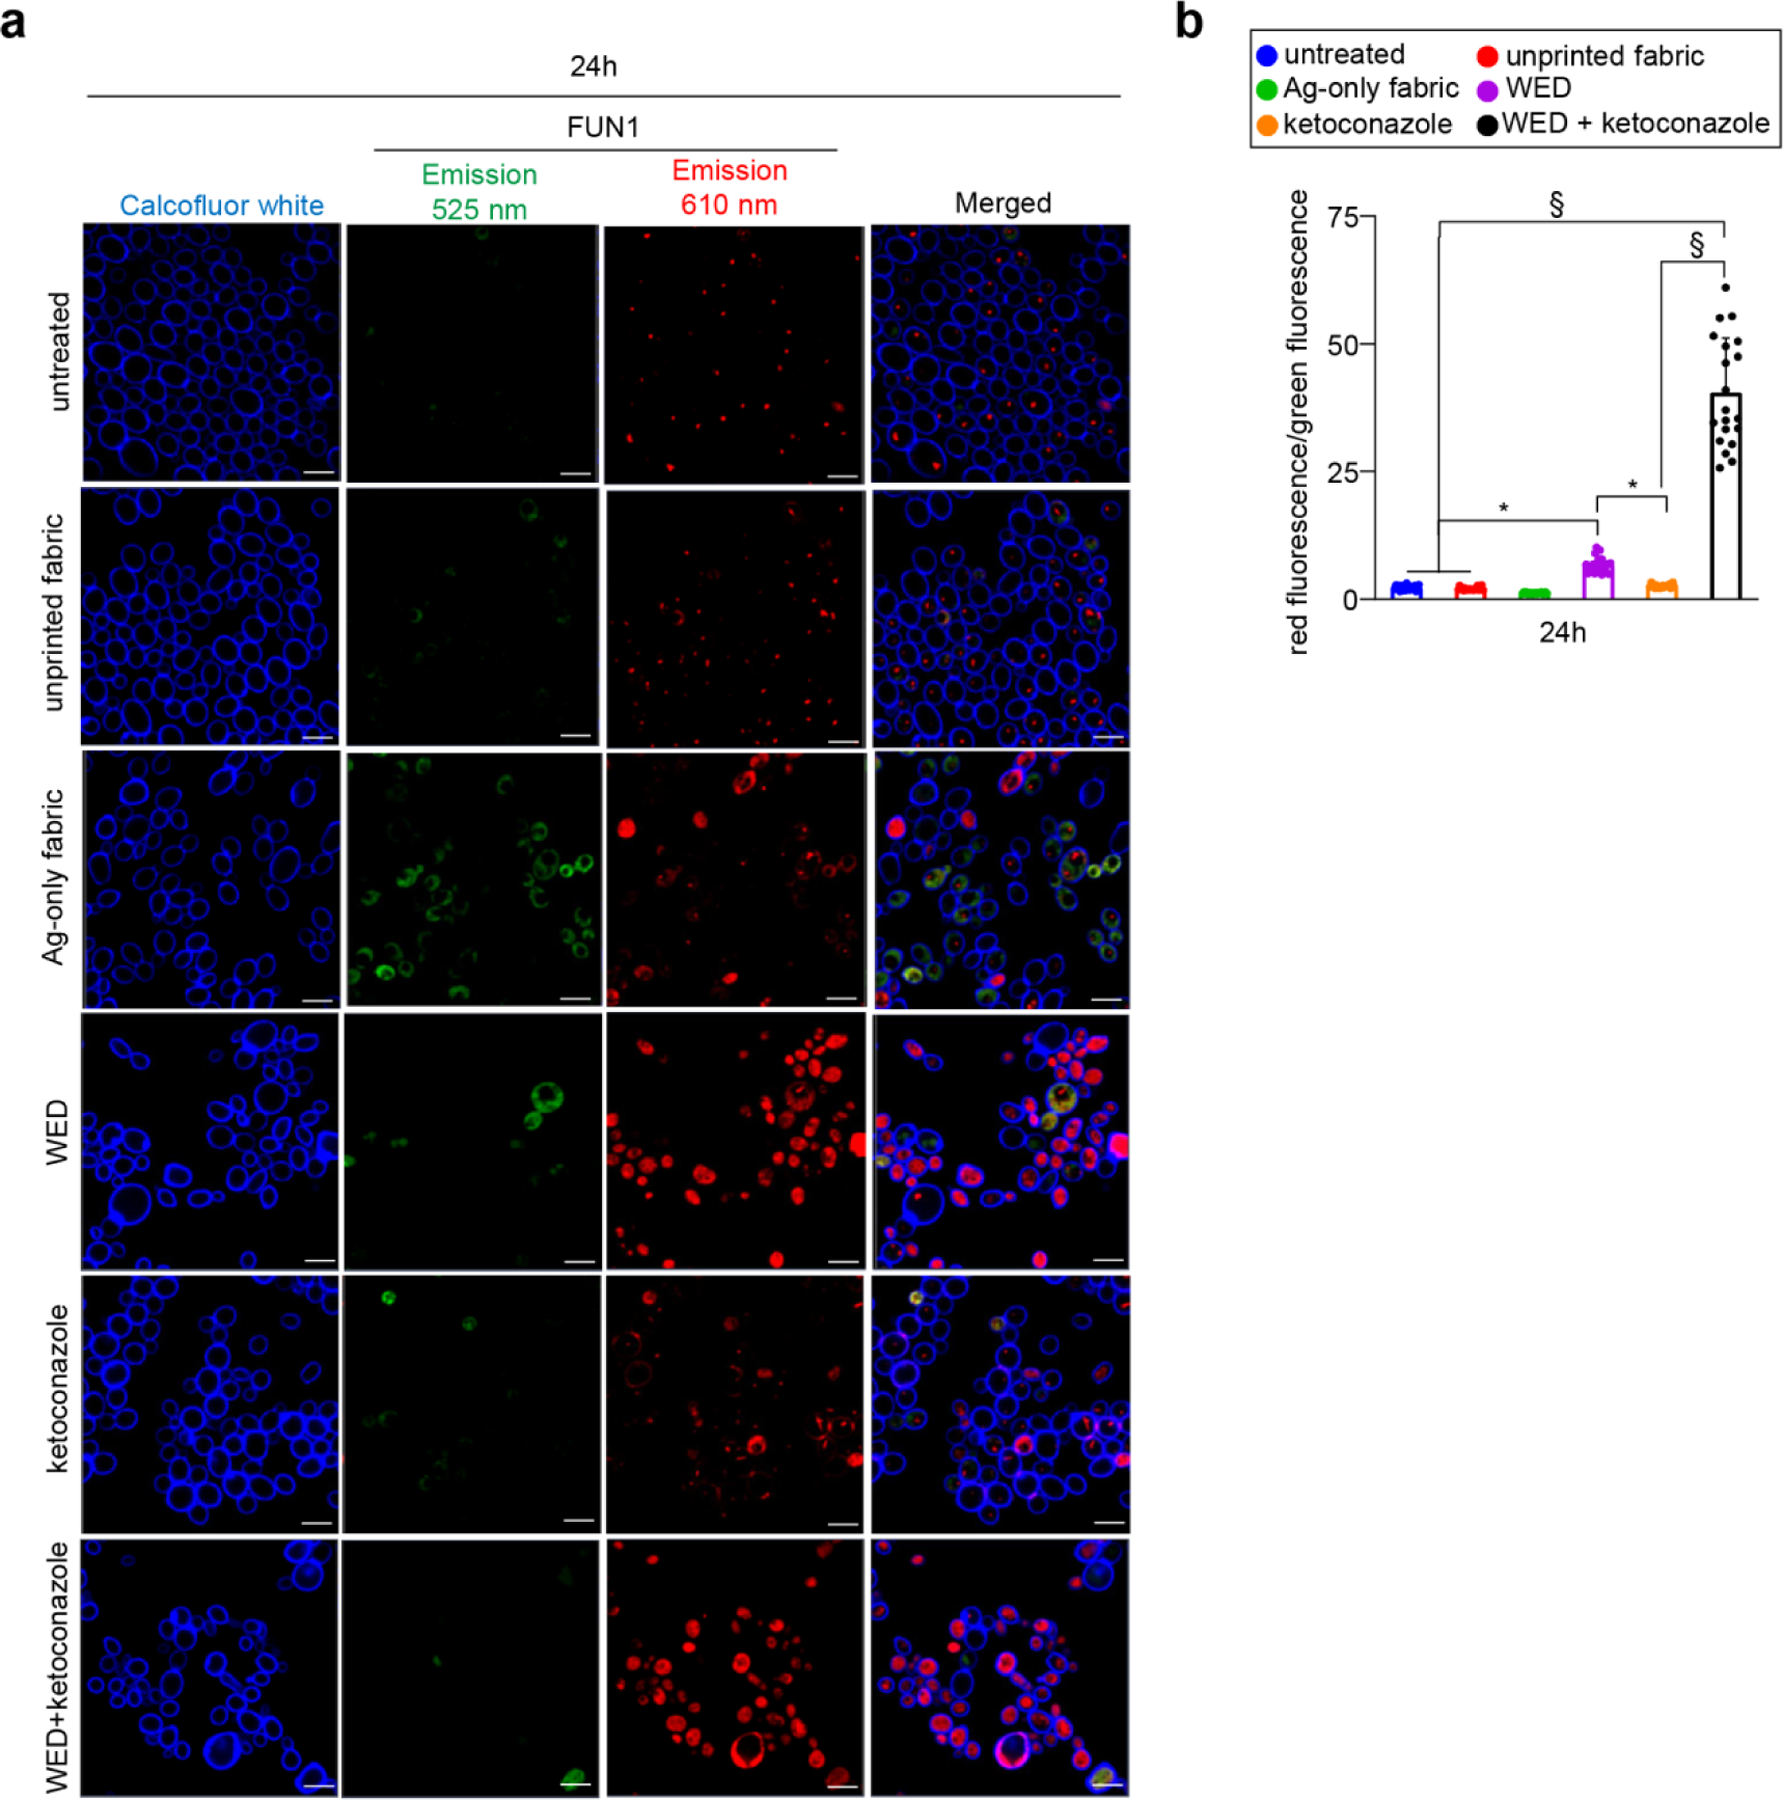
Figure 5: WED impaired metabolism in Ketoconazole resistant Candida albicans.

(a) Representative images showing effect of fabrics or ketoconazole on C albicans metabolism. After 24h growth in YPD broth, C albicans were stained with FUN1™ and Calcofluor white. After staining, cells were imaged at 63X magnification for differential staining patterns of FUN1™. Scale bar represents 5 µm. Display settings for all images were kept same. (b) Quantitative assessment of metabolic impairment in C albicans cells. Aforementioned microscopic images were analyzed for red and green fluorescence intensities using Zen Blue software and a ratio of red fluorescence intensity over green fluorescence intensity was plotted for all groups. This ratio is an indirect representation of metabolism impairment and viability loss in C albicans cells. n = 20 images. §P ≤ 0.0001 and *P ≤ 0.05 (One-way ANOVA followed by post-hoc Sidak multiple comparison test). Data are represented as the mean ± SD.
