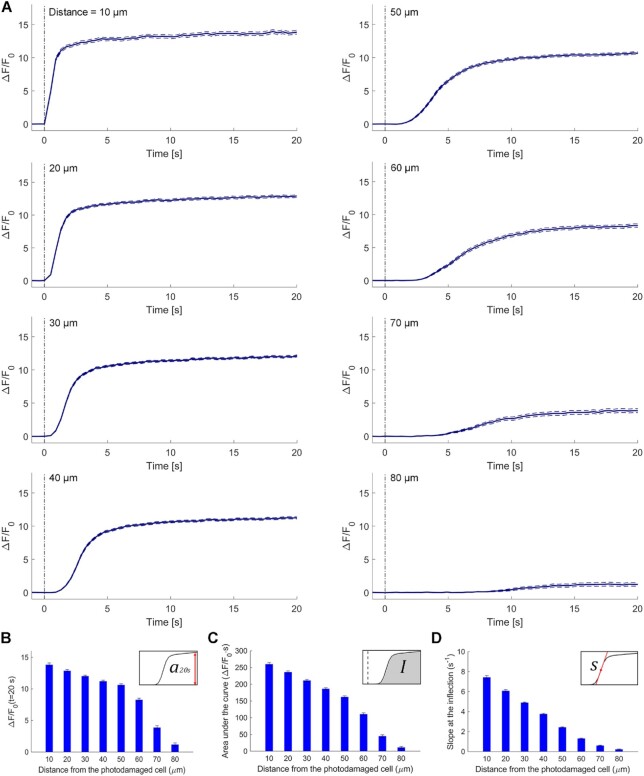
Figure 3.
Analysis of GCaMP6s fluorescence changes in bystander keratinocytes at increasing distance from the photodamage site. (A) In each panel, the vertical black dash-dotted line at 0 s marks the end of the 0.5 s photodamage time interval. Data are mean (solid line) ± s.e.m. (dashed lines) vs. time for n = 60 experiments in 15 mice. (B) Amplitude (a20s) of the  signal at time t = 20 s. (C) Area (I) under the
 trace, computed between 0 and 20 s. (D) Slope (s) of the
  trace at the inflection point (mean ± s.e.m). Data in (B-D) are mean ± s.e.m. vs. bystander cell distance from the photodamage site.

