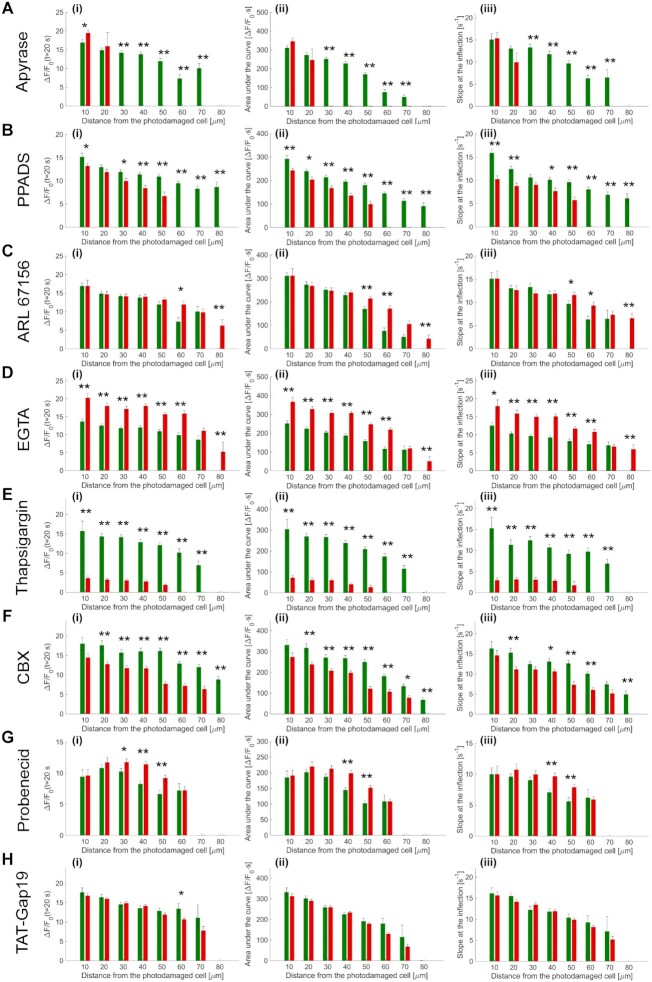
Figure 4.
Summary of pharmacological interference experiments results. (i) Amplitude (a20s) of the  signal at time t = 20 s. (ii) Area (I) under the
 trace, computed between 0 and 20 s. (iii) Slope (s) of the
  trace at the inflection point (mean ± s.e.m). Data are mean ± s.e.m. vs. bystander cell distance from the photodamage site in control conditions (green) and after VS microinjection (red) containing one of the following drugs: apyrase 500 U/ml (A), PPADS 625 µM (B), ARL 400 µM (C), EGTA 5 mM (D), thapsigargin 400 nM (E), carbenoxolone 200 µM (CBX, F), probenecid 4 mM (G), TAT-Gap19 200 µM (H). Significant differences are shown above each pair of bars (two-sample t-test): * = P-value < 0.05; ** = P-value < 0.005.

