Figure 7.
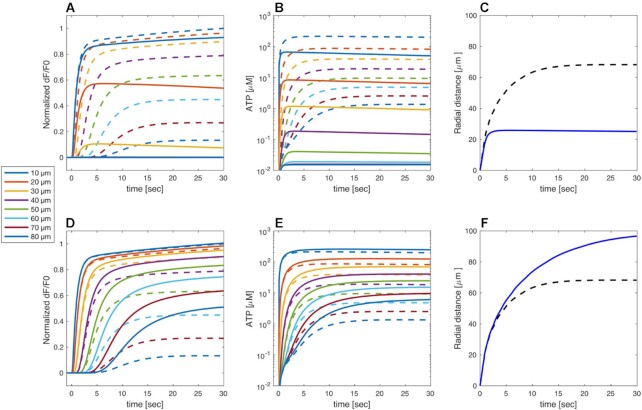
Model simulation of interference with extracellular ATP handling. (A-C) Simulated apyrase experiment performed by increasing 10-fold the ATP degradation rate k (full curves). The simulations under control conditions (from Figures 5 and 6) are shown for comparison as dashed curves with the same color code. (A) Simulated normalized GCaMP6s fluorescence responses, as indicated by the color codes in the legend. (B) Model extracellular ATP levels. (C) Equivalent radii from apyrase (blue solid line) and control (black dashed line, same as black solid line in Figure 5E) simulations. (D-F) Simulated ARL experiment performed by decreasing the ATP degradation rate k by 50% (solid lines). Legends as in panels A-C. Traces in panels A, B, D, E were computed at increasing distances, in 10 µm steps, from the center of the damaged cell.

