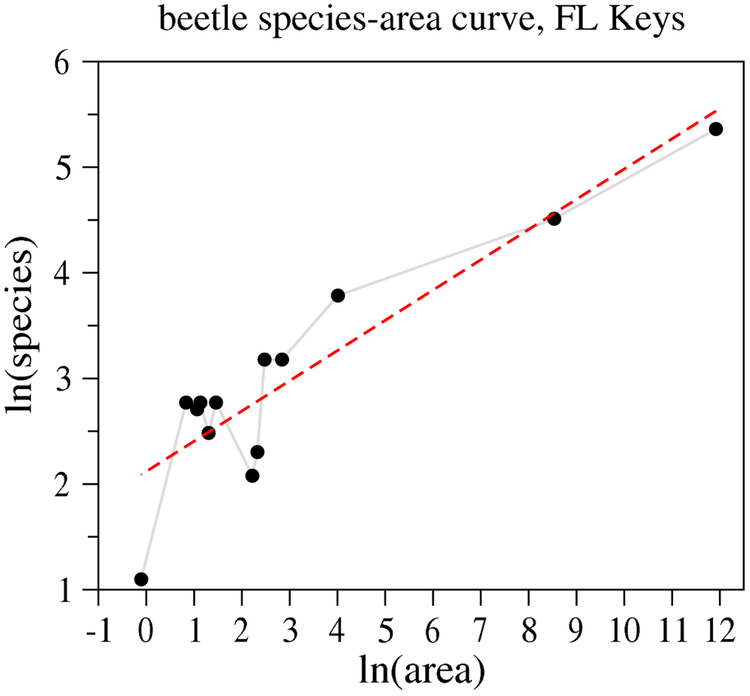
Figure 3.
Plot of ln R versus ln A with area A measured in terms of km2. Species counts of long-horned beetles in the Florida Keys are plotted against the island size [98]. The linear regression line yields a slope of z = 0.29. Usually, fits of the species-area exponent z yield a small number.

