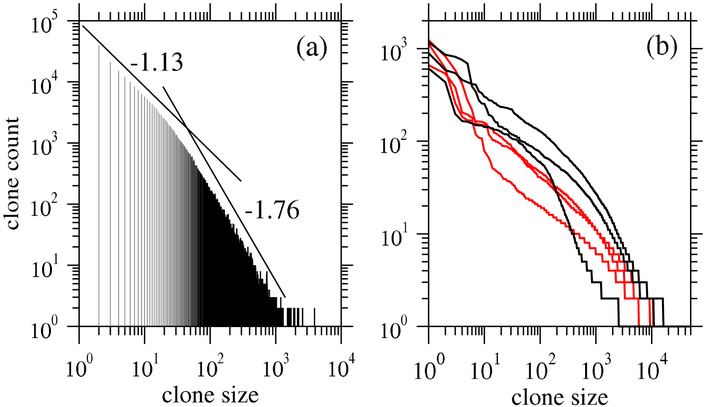
Figure 8.
Examples of recently published clone count data. (a) Clone counts derived from a small sample (105 sequences) of T cells [142]. Note the broad distribution described by a biphasic power-law curve. Ignoring the largest clones, power-law fits for each regime yield slopes of – 1.13 and – 1.76. However, one should be cautious describing sampled TCR (and BCR) clone counts using power laws as they hold typically for far less than two decades. (b) Human TCR clone counts for three HIV-infected (red) and three uninfected (black) individuals show qualitative differences between the distributions (unpublished). Other data from mice and humans, under different conditions and in different cell types, have been recently published [149, 150].

