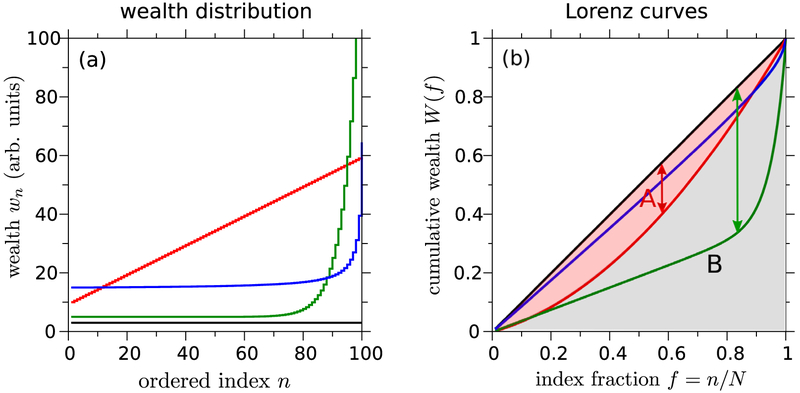
Figure 9.
(a) Ordering of all N = 100 individuals in increasing wealth or income. The hypothetical wealth distributions plotted are wi = 3 (equal wealth, black curve), wi = 10 + (i − 1)/2 (linear distribution, red), Wi = 5 + ei/5−15 − e−14.8 (green), and wi = 14.5 + 50/(101 − i) (blue). The latter three represent distributions with some amount of inequity. (b) These inequalities can be visually quantified by their corresponding Lorenz curves, plotted as the relative fraction of the population f. The Lorenz curve for a perfectly uniform wealth distribution is given by the straight diagonal line. The area between the diagonal equality line and any other Lorenz curve can be used to visualize the Gini coefficient of the associated wealth distribution. The Gini coefficient, Gini = A/(A + B), is calculated by dividing the difference in areas between the equality line and the Lorenz curve in question (A) by the total area (A + B = 1/2) under the equality curves. The ‘Robin Hood’ index is defined as the maximum difference between the equality line and a given Lorenz curve, and is indicated by arrow for the red and green Lorenz curves.

