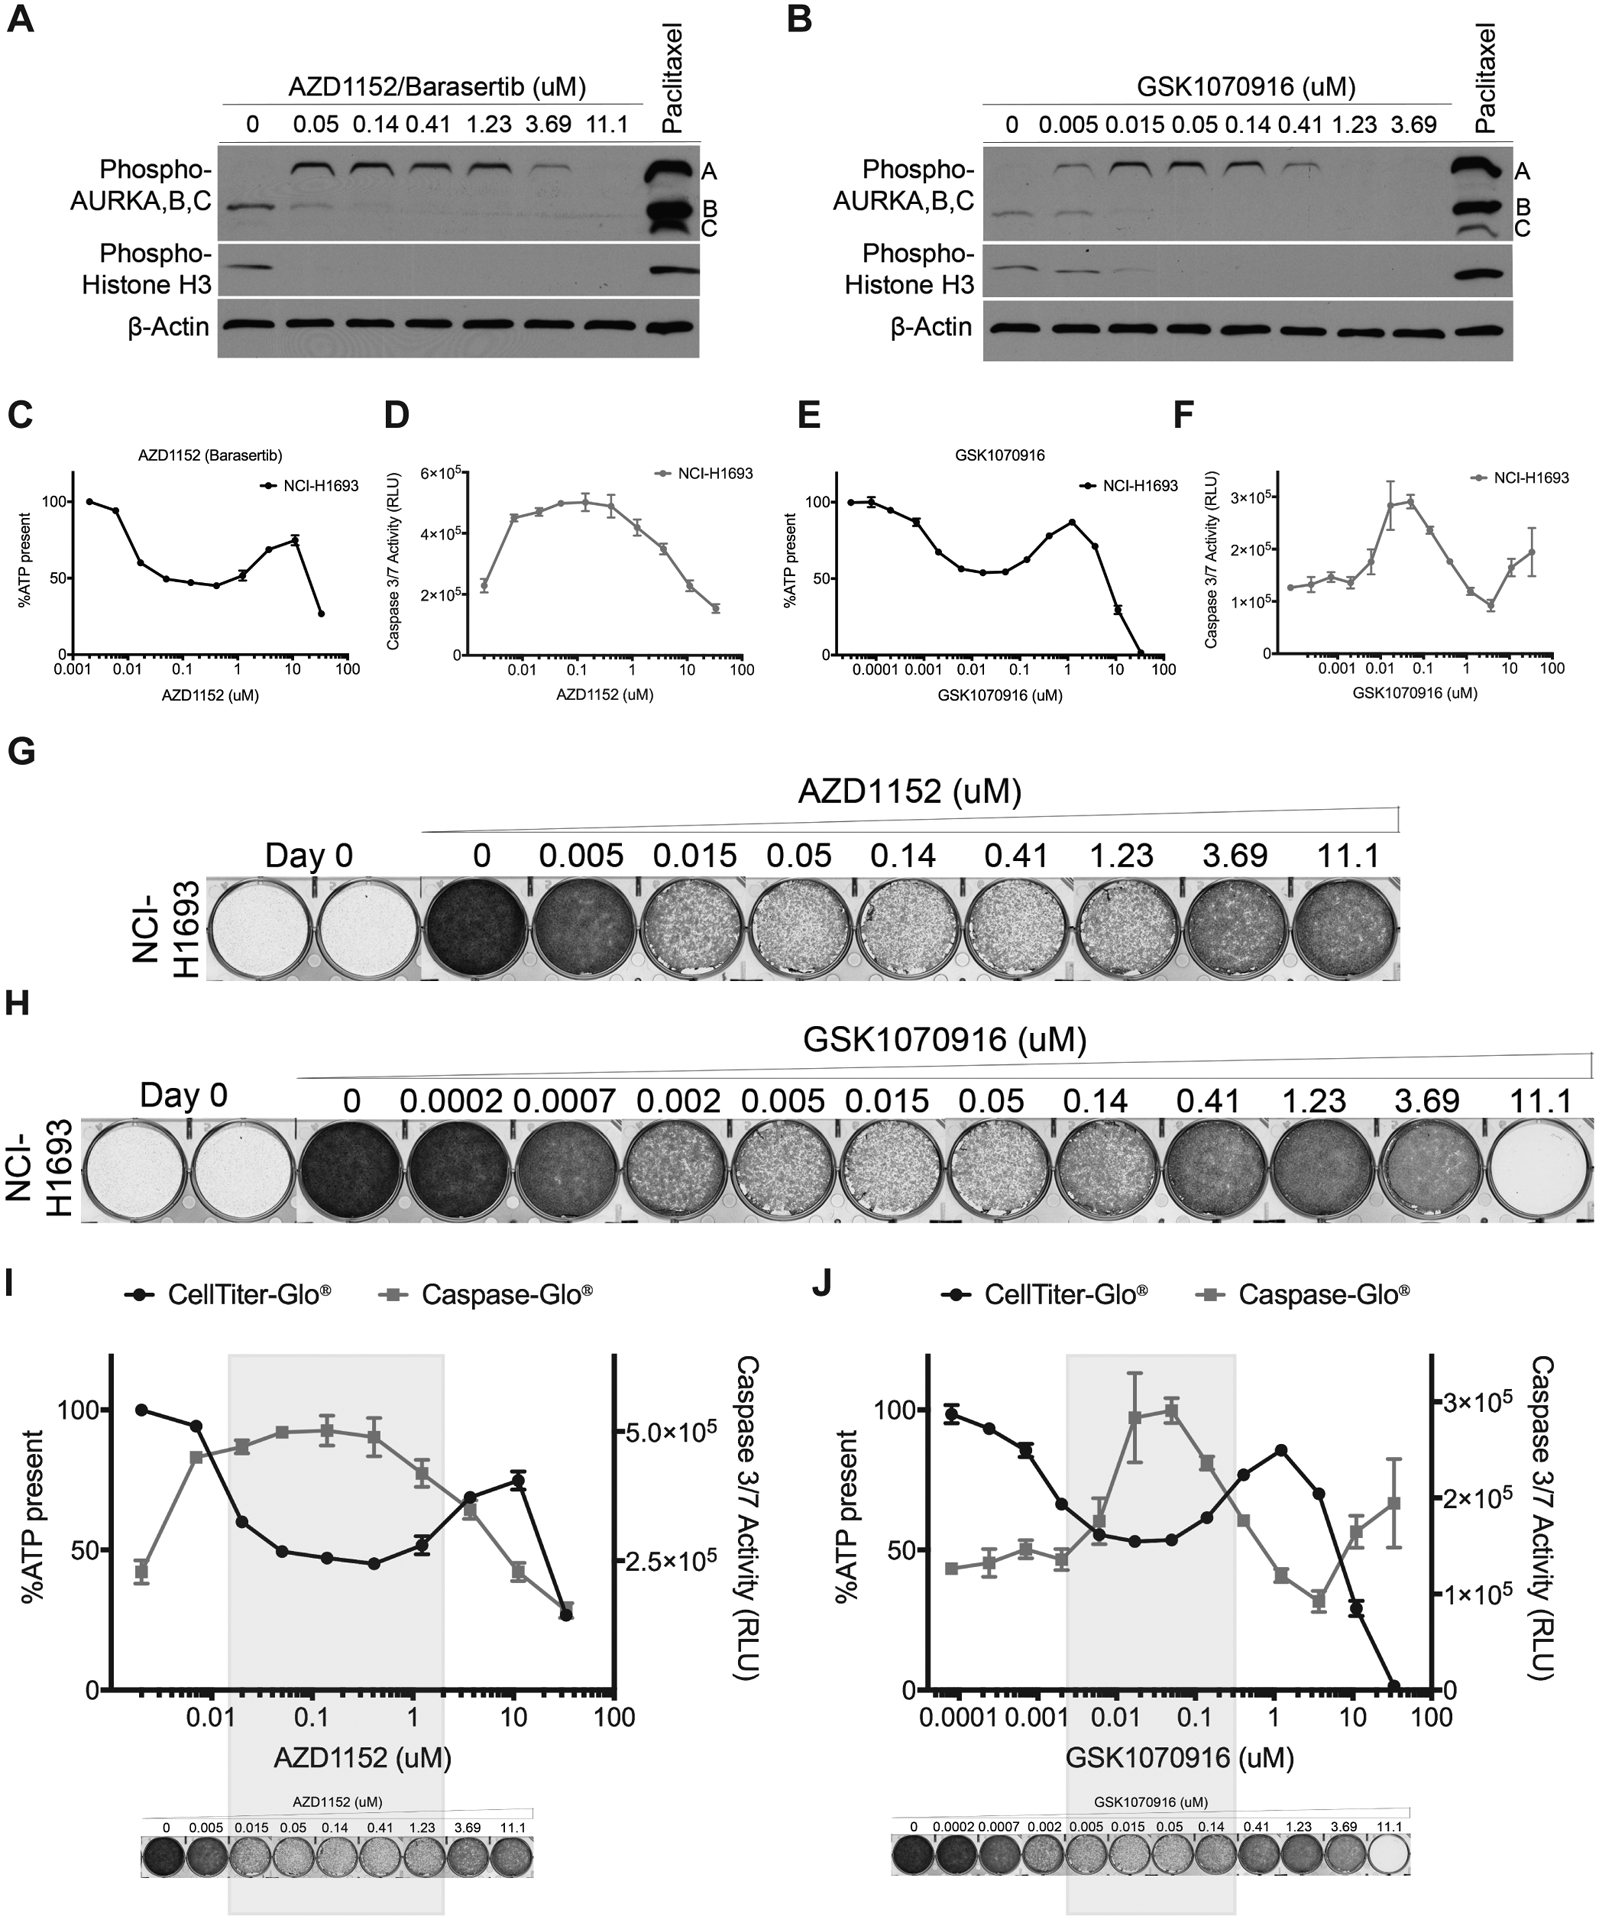
Figure 3. Aurora B, C inhibitors exhibit a camelback drug response pattern similar to Aurora A inhibitors.

A, Cell lysates of NCI-H1693 cells were collected 48-hours after treating with AZD1152 (Barasertib) or B, GSK1070916 and immunoblotted to monitor phosphorylated histone H3 and phosphorylated Aurora A, B, C levels. Paclitaxel was used in both sets of immunoblots as positive control and β-Actin was used as internal immunoblotting control. C, NCI-H1693 cells were treated with serial concentrations of AZD1152 for four days and cell viability was measured with a CellTiter-Glo assay. D, NCI-H1693 cells were treated with serial concentrations of AZD1152 for two days and cell death was measured with a CaspaseGlo 3/7 assay. E, F, Assays were repeated with GSK1070916 treatments. Data are means of triplicate biological replicates with s.d. Some error bars are smaller than the data symbols. G, NCI-H1693 cell line was treated with serial concentrations of AZD1152 or H, GSK1070916 for seven days and cell growth was measured with a crystal violet staining assay. I, J, Overlay of cell viability, caspase 3/7 activity and crystal violet staining images with immunoblotting results at selective and non-selective concentrations of AZD1152 and GSK1070916.
