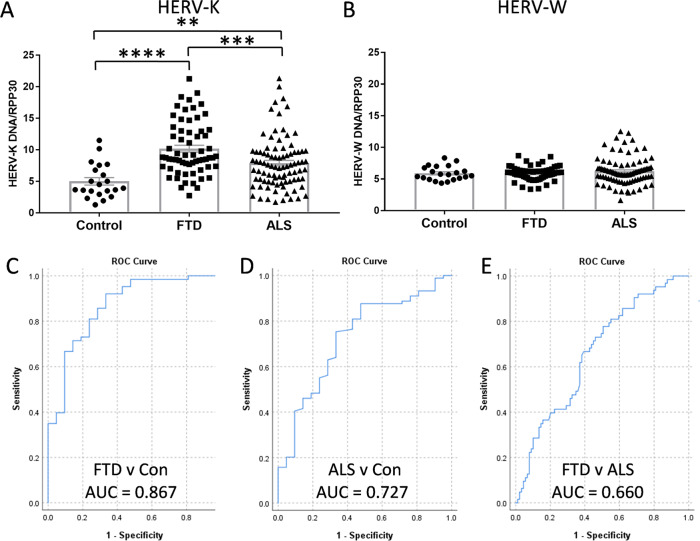
Fig. 2. A comparison of HERV-K levels in FTD and ALS.
A HERV-K env levels in FTD (n = 63), ALS (n = 89) and control (n = 21) serum as measured by ddPCR. B HERV-W env levels in FTD (n = 63), ALS (n = 89) and control (n = 21) serum as measured by ddPCR. (C) HERV-K ROC curve for FTD vs. Con. D HERV-K ROC curve for ALS vs. Con. E HERV-K ROC curve for FTD vs. ALS. Data represent individual patients, mean and SE as error bars, **P < 0.01, ***P < 0.001, ****P < 0.000005.

