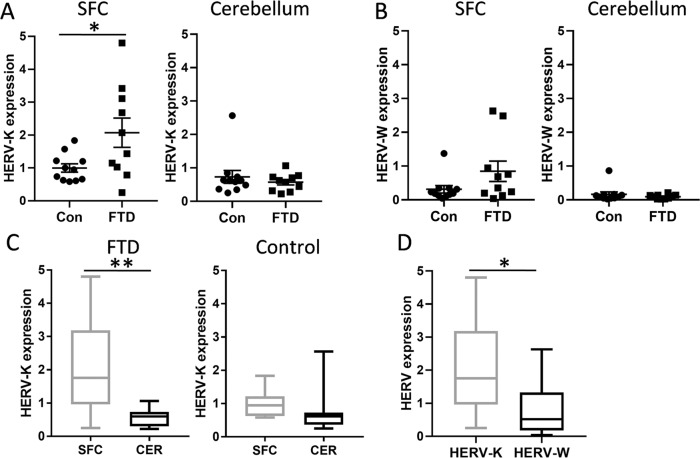
Fig. 3. Expression of HERV-K in FTD brain.
A HERV-K env mRNA expression in the superior frontal cortex (SFC) and cerebellum of FTD (n = 10) and control (n = 11) brain as measured by qPCR. Data represent mean and SE as error bars. B HERV-W env mRNA expression in the SFC and cerebellum of FTD (n = 10) and control (n = 11) brain as measured by qPCR. Data represent mean and SE as error bars. C A comparison of HERV-K env expression in the SFC and cerebellum in FTD (n = 10 SFC, n = 10 cerebellum) and control (n = 11 SFC, n = 11 cerebellum). Data represent median with min and max as whiskers. D A comparison of HERV-K and HERV-W env expression in FTD SFC (n = 10). Data represent median with min and max as whiskers. *P < 0.05, **P < 0.01.

