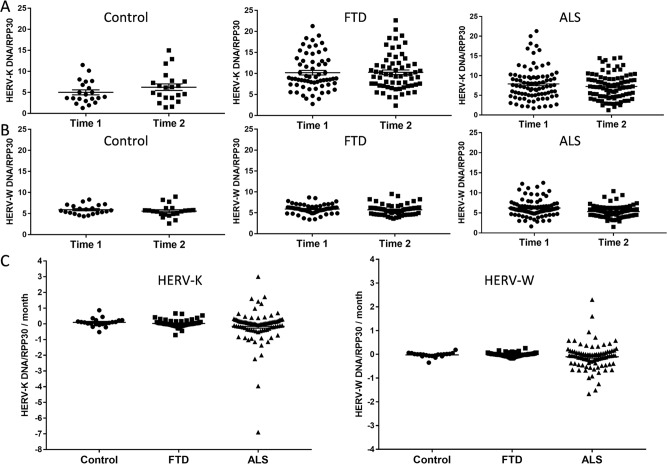
Fig. 6. A longitudinal assessment of HERV-K levels in FTD and ALS serum.
A HERV-K levels at two time points; the mean of number of months between the two time points were 28 for FTD (n = 63), 9 for ALS (n = 89) and 22 for controls (n = 21). B HERV-W levels at two time points in FTD (n = 63), ALS (n = 89) and control (n = 21) serum. C Rate of change in HERV-K and HERV-W levels in FTD (n = 63), ALS (n = 89) and control (n = 21) serum. Data represent individual patients, mean and SE as error bars.

