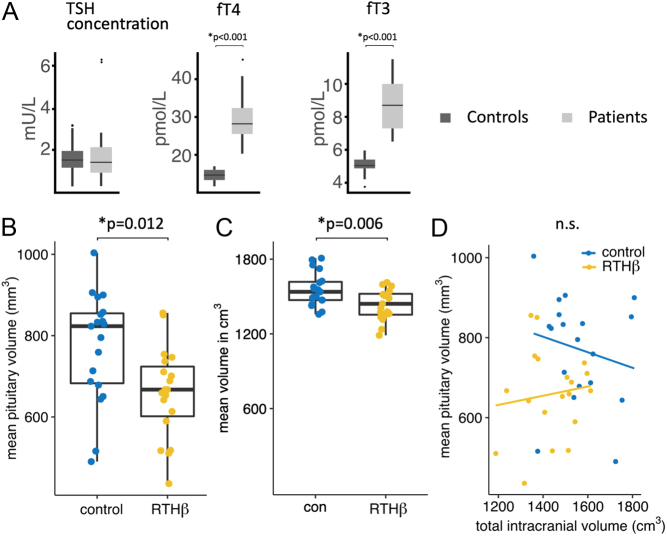
Figure 1.
(A) Levels of TSH, fT4 and fT3 in RTHβ and healthy controls. Significant results for fT4 and fT3 are stated with no significant differences for TSH. Results are shown in box plots including mean and interquartile ranges of hormone levels. Reference range for TSH was 0.35–5.5 mU/L, fT4 10–19.8 pmol/L and fT3 3.5–6.5 pmol/L. (B) Distribution of mean pituitary volumes of controls vs patients shown by box plots including mean and interquartile range of pituitary glands (in mm3). (C) Distribution of mean total intracranial volumes of controls vs patient shown by box plots including mean and interquartile range of intracranial volumes (in cm3). (D) Scatter plot showing relationship and linear regression lines between the pituitary gland and total intracranial volumes per group. Significant results are shown, n.s., not significant.

 This work is licensed under a