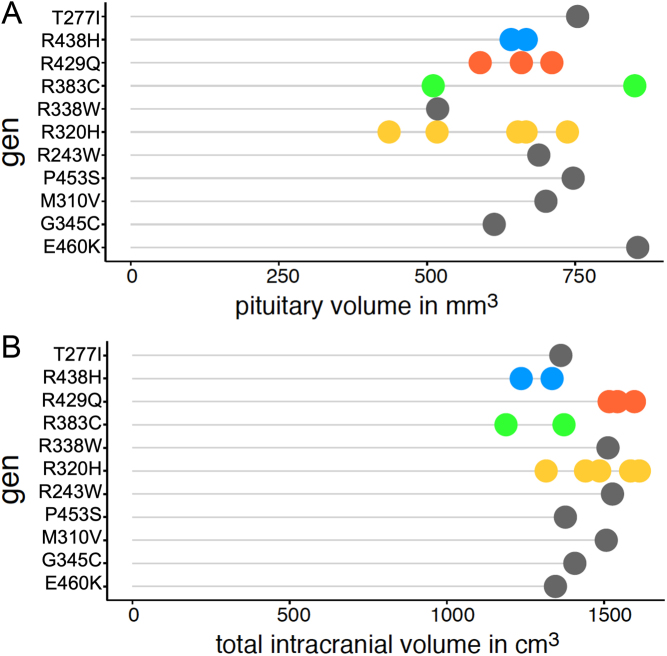
Figure 3.
(A) Pituitary gland volume and (B) total intracranial volume (TIV) for each individual mutation. Displayed are the volumes per subject, sorted according to the respective mutation. Each genetic mutation that occurs more than once in our sample is colour- coded (see y-axis), mutations that occur only once are displayed in grey.

 This work is licensed under a