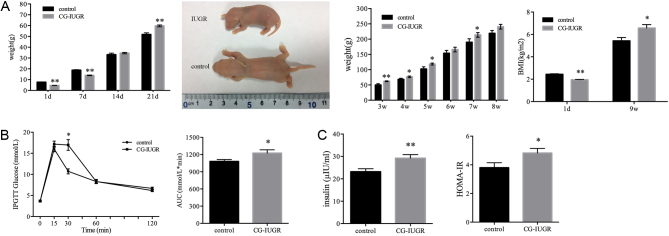
Figure 1.
CG-IUGR model and systemic insulin sensitivity. (A) Body weight and BMI between control and CGIUGR rats (n = 25 for IUGR and n = 40 for the control group before weaning, n = 6 for IUGR and the control group after weaning (two pups each litter)). (B) Blood glucose at 30 min and AUC of IPGTT were increased in the male CG-IUGR rats (n = 6 for each group). (C) Plasma insulin levels and HOMA-IR were elevated in male CG-IUGR rats (n = 6 for each group). Data are presented as mean ± s.e.m. *P < 0.05, **P < 0.01 compared with same-age controls.

 This work is licensed under a