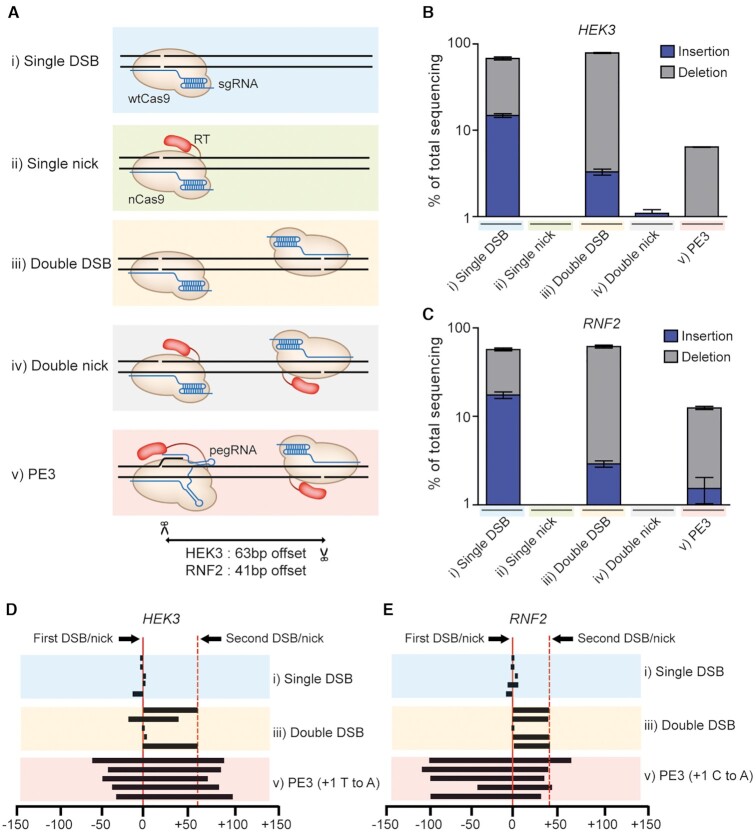
Figure 3.
Comparison of indel frequencies and endpoints after different DNA cleavage and nicking scenarios. (A) Schematic of enzymes and guide RNAs tested to compare indel frequencies. (B, C) Indel frequencies generated by the experimental set ups diagrammed in (A) at the HEK3 and and RNF2 genomic sites. (D, E) Deletion patterns obtained after single cuts, double cuts, and PE3-mediated base substitutions at the HEK3 and RNF2 sites. Each line designates the extent of a deletion. The five most frequent types of deletions are shown for each case. Mean ± s.d. of n = 3 independent biological replicates.

