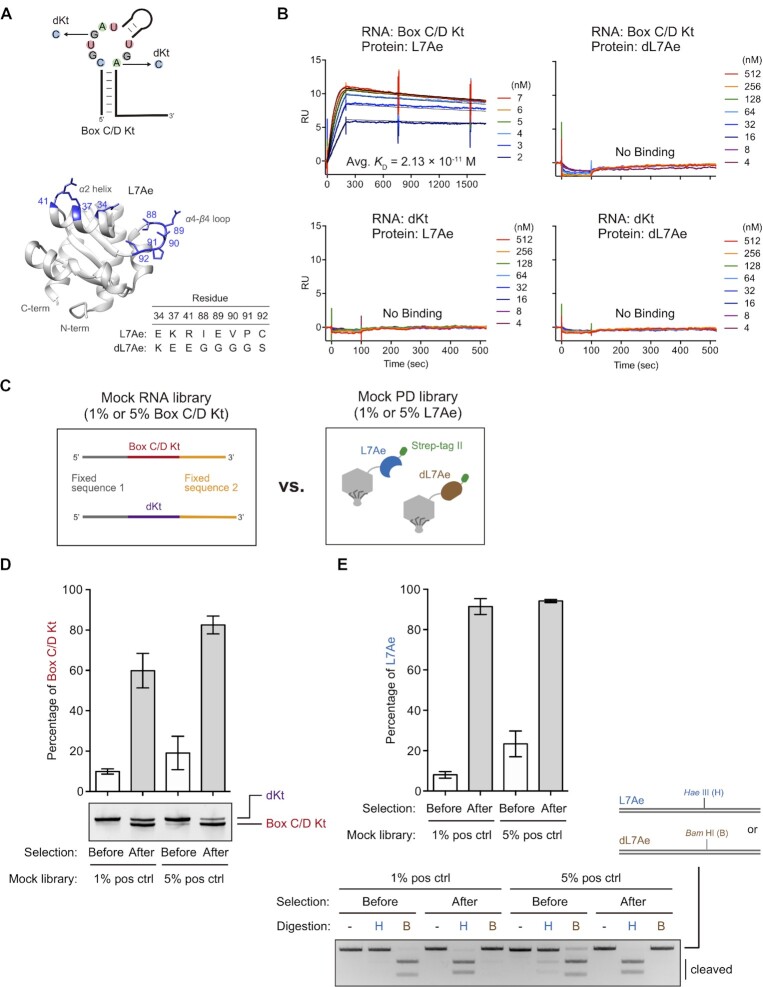
Figure 2.
Mock selection. (A) Schematic representation of the box C/D Kt and dKt (defective Kt) RNAs, and A. fulgidus L7Ae structure (PDB ID, 4BW0) (54) depicting the mutated residues in dL7Ae. The graphic was generated using UCSF Chimera (71). (B) Confirmation of binding specificity of the RNAs (box C/D Kt or dKt) and the recombinant proteins (L7Ae or defective L7Ae: dL7Ae) by SPR. Sensorgrams are shown in colored lines, and black lines indicate curve fitting according to 1:1 binding model. RU stands for response unit. The observed kinetic values and dissociation constants are summarized in Table 1. For box C/D Kt–L7Ae, dissociation time was extended to 25 min from 7 min to monitor slow dissociation. (C) Schematic illustration of the mock libraries. (D) Mock RNA library selection. RT-PCR products (20 ng) were separated by native PAGE and visualized by SYBR Gold staining. The sizes of the box C/D Kt and dKt are 91 bp and 96 bp, respectively. The band intensities were quantified using ImageJ. The bar graph represents means and standard deviations of three independent experiments. (E) Mock PD library selection. PCR products (100 ng) were digested with a restriction enzyme Hae III (H) or Bam HI (B), and then separated by 2% agarose gel electrophoresis. DNAs were visualized by ethidium bromide staining. The band intensities were quantified using ImageJ, and the bar graph represents means and standard deviations of three independent experiments.

