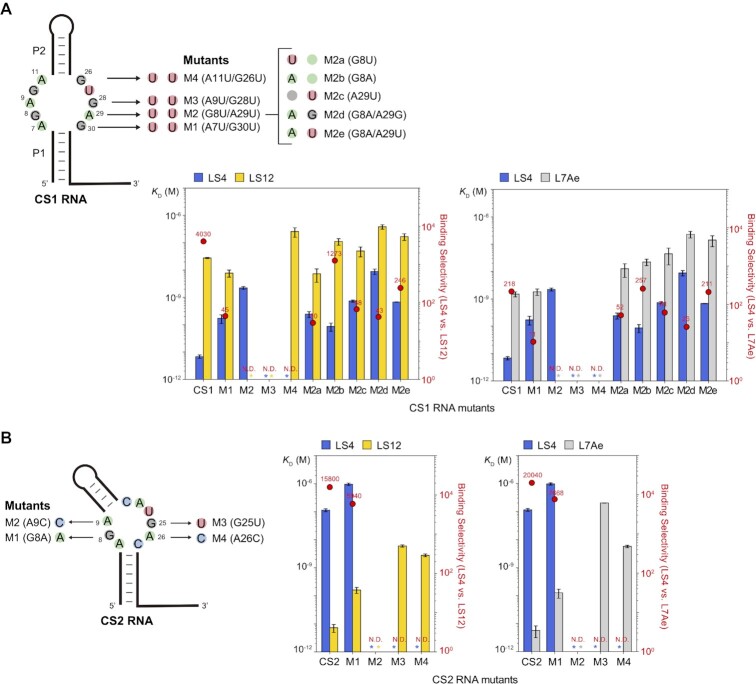
Figure 6.
Binding selectivities of LS4, LS12, and L7Ae for (A) CS1 RNA and its mutants, and (B) CS2 RNA and its mutants. The bar graphs represent means and standard deviations of the KD values derived from at least two independent experiments. Red dots represent binding selectivity (ratio of the KD values) of the RNA for the two proteins. Asterisks indicate either no binding or weak binding with undetermined KD value based on SPR. Binding selectivity could not be determined for these RNAs (N.D.). SPR sensorgrams and binding parameters are shown in Supplementary Figure S10 and Supplementary Table S4.

