Figure 4.
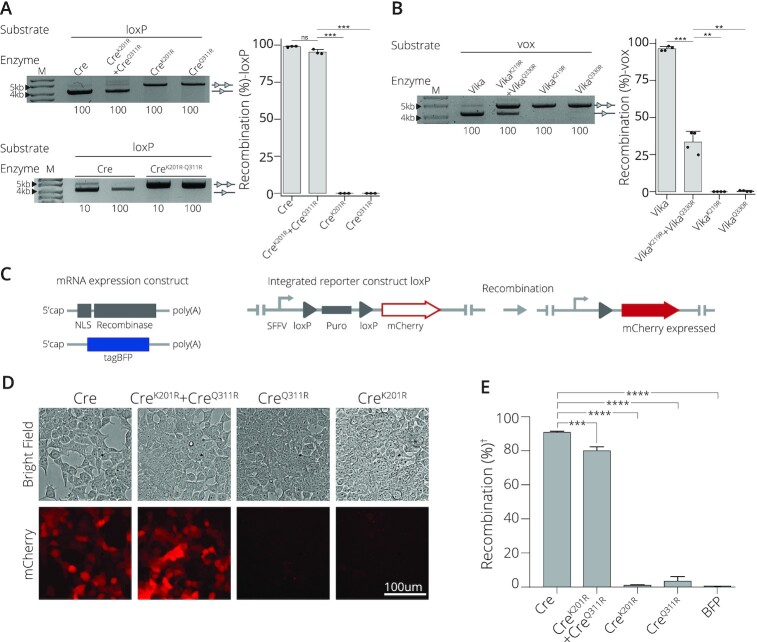
Application of obligate mutations to natural recombinase systems. (A) Introduction of point mutations renders Cre recombinase obligate. Activity on loxP of both mutations applied to a single subunit, CreK201R-Q311R; co-expression of CreK201R and CreQ311R; or expression as a single mutated subunit of CreK201R or CreQ311R in isolation are shown. The concentration of L-Arabinose (μg/ml) is listed along the bottom. Bands of non-recombined plasmids are indicated by a line with two triangles, while recombined bands are marked by a line with one triangle. M = GeneRuler DNA Ladder Mix 10kb. Quantified recombination of bacterial assay. Recombinases Cre, CreK201R+ CreQ311R, CreK201R and CreQ311R recombination (%) activity on loxP target site. Recombination as percentage along the y-axis. Bacterial assays are done in triplicates (n = 3) plotted as points on the bar graphs. (B) Recombination activity on the vox target site of Vika compared to Vika with the obligate correlating mutations of K291R (VikaK219R) in one subunit and Q330R (VikaQ330R) in the second mutated subunit. Bands of non-recombined plasmids are indicated by a line with two triangles, while recombined bands are marked by a line with one triangle. Concentration (μg/ml) of L-Arabinose used for recombinase induction is indicated along the bottom. M = 10 kb ladder. Quantified recombination of bacterial assay. Recombinases Vika, VikaK219R + VikaQ330R, VikaK219R and VikaQ330R recombination (%) activity on vox target site. Recombination as percentage along the y-axis. Bacterial assays are done in triplicates (n = 3) plotted as points on the bar graphs. (C) Scheme of mRNAs and the employed HEK293T loxP reporter cell line. mRNAs with indicated features (5′cap and polyA tail) expressing a nuclear localization signal (NLS) fused to the recombinase and the tagBFP mRNA are shown. The stable reporter cell line harbors two loxP sites (gray triangles) that flank a puromycin selection gene (puro). Once successfully excised by recombination, mCherry is expressed from the SFFV promoter (arrow). (D) Evaluation of recombination efficiency by microscopy. Bright field and fluorescent mCherry cell images for cells transfected with indicated mRNAs are shown. Scale bar = 100 μm. (E) | FACS-based quantification of recombination efficiency. The percentage of mCherry-positive cells is shown for indicated mRNA transfections. (†) indicates normalization to BFP signal. Error bars represent the standard deviation from the mean of experiments performed in biological triplicates (n = 3) and statistical relevance of the triplicates was assessed using an unpaired t-test, non-corrected for multiple comparisons. (ns): P > 0.5, (*): P ≤ 0.05, (**): P ≤ 0.01, (***): P ≤ 0.001, (****): P ≤ 0.0001.

